A/B Testing: What It Is and How to Do It Properly

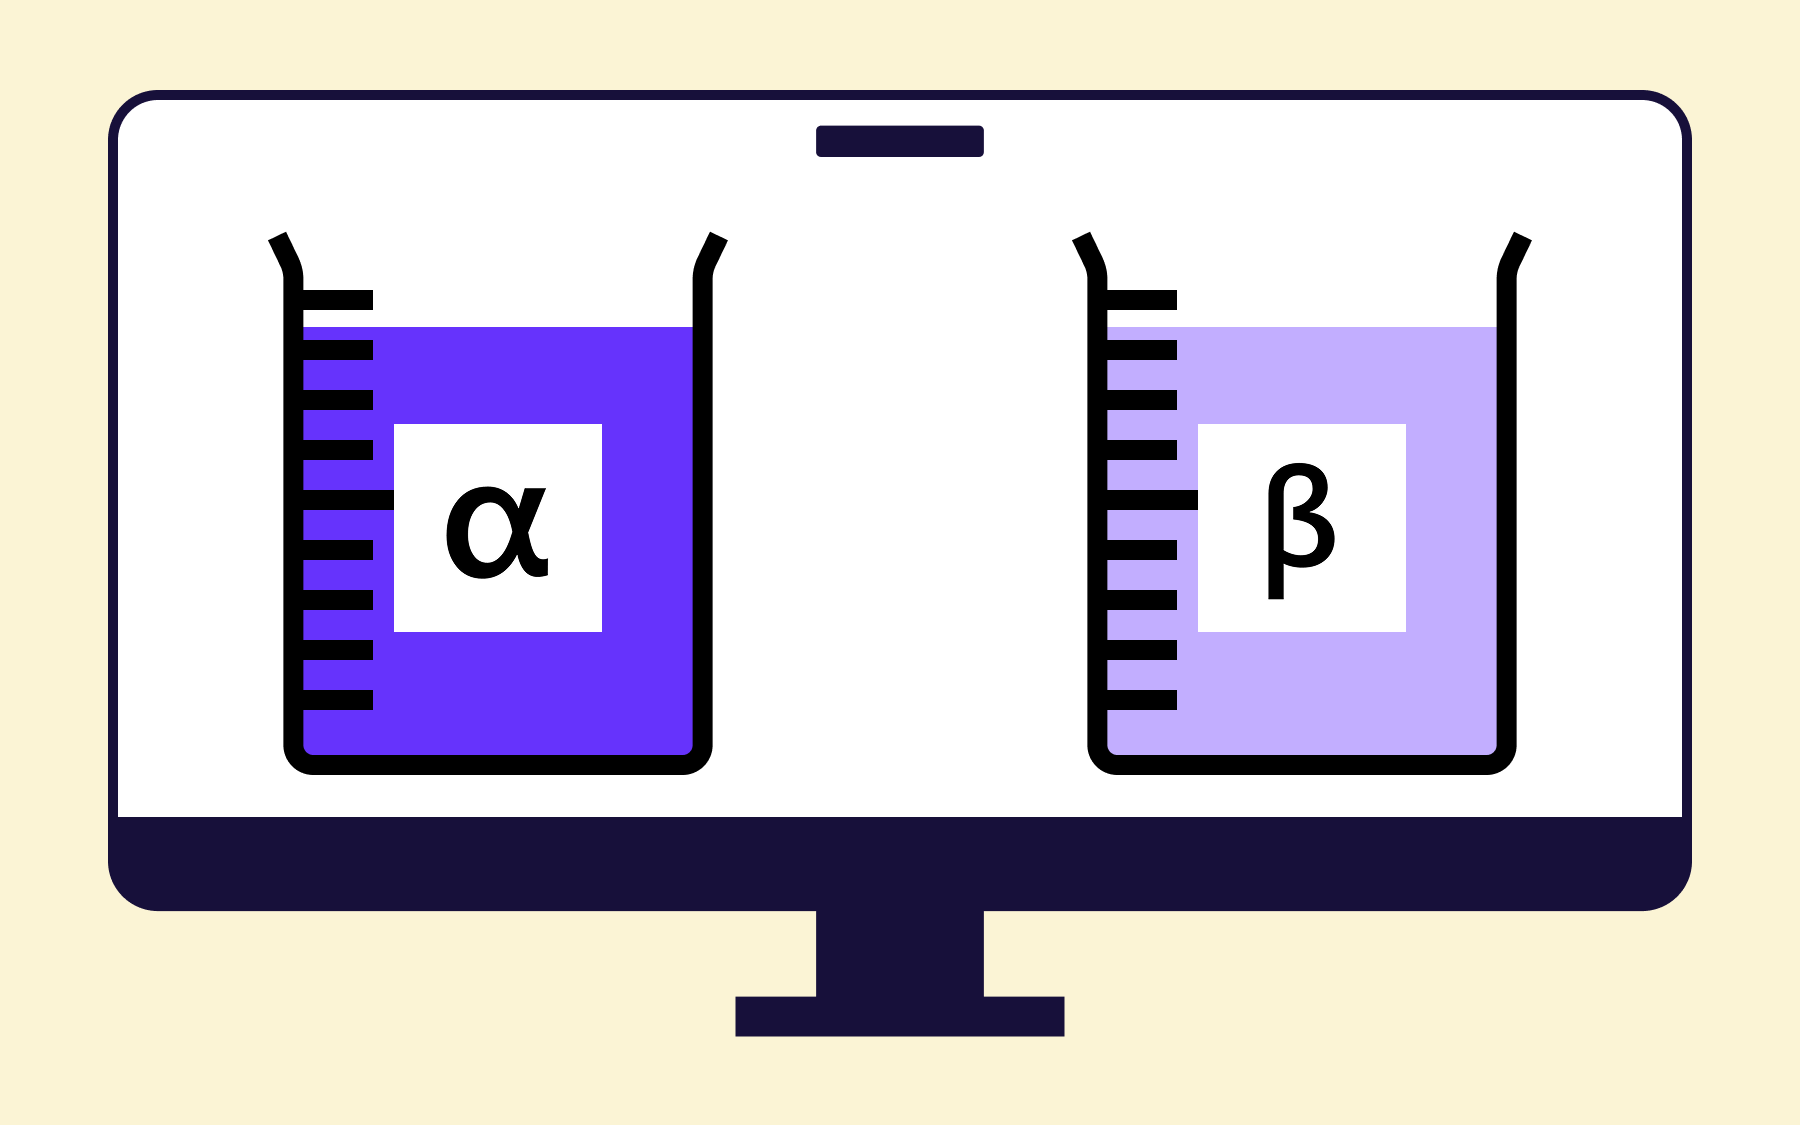
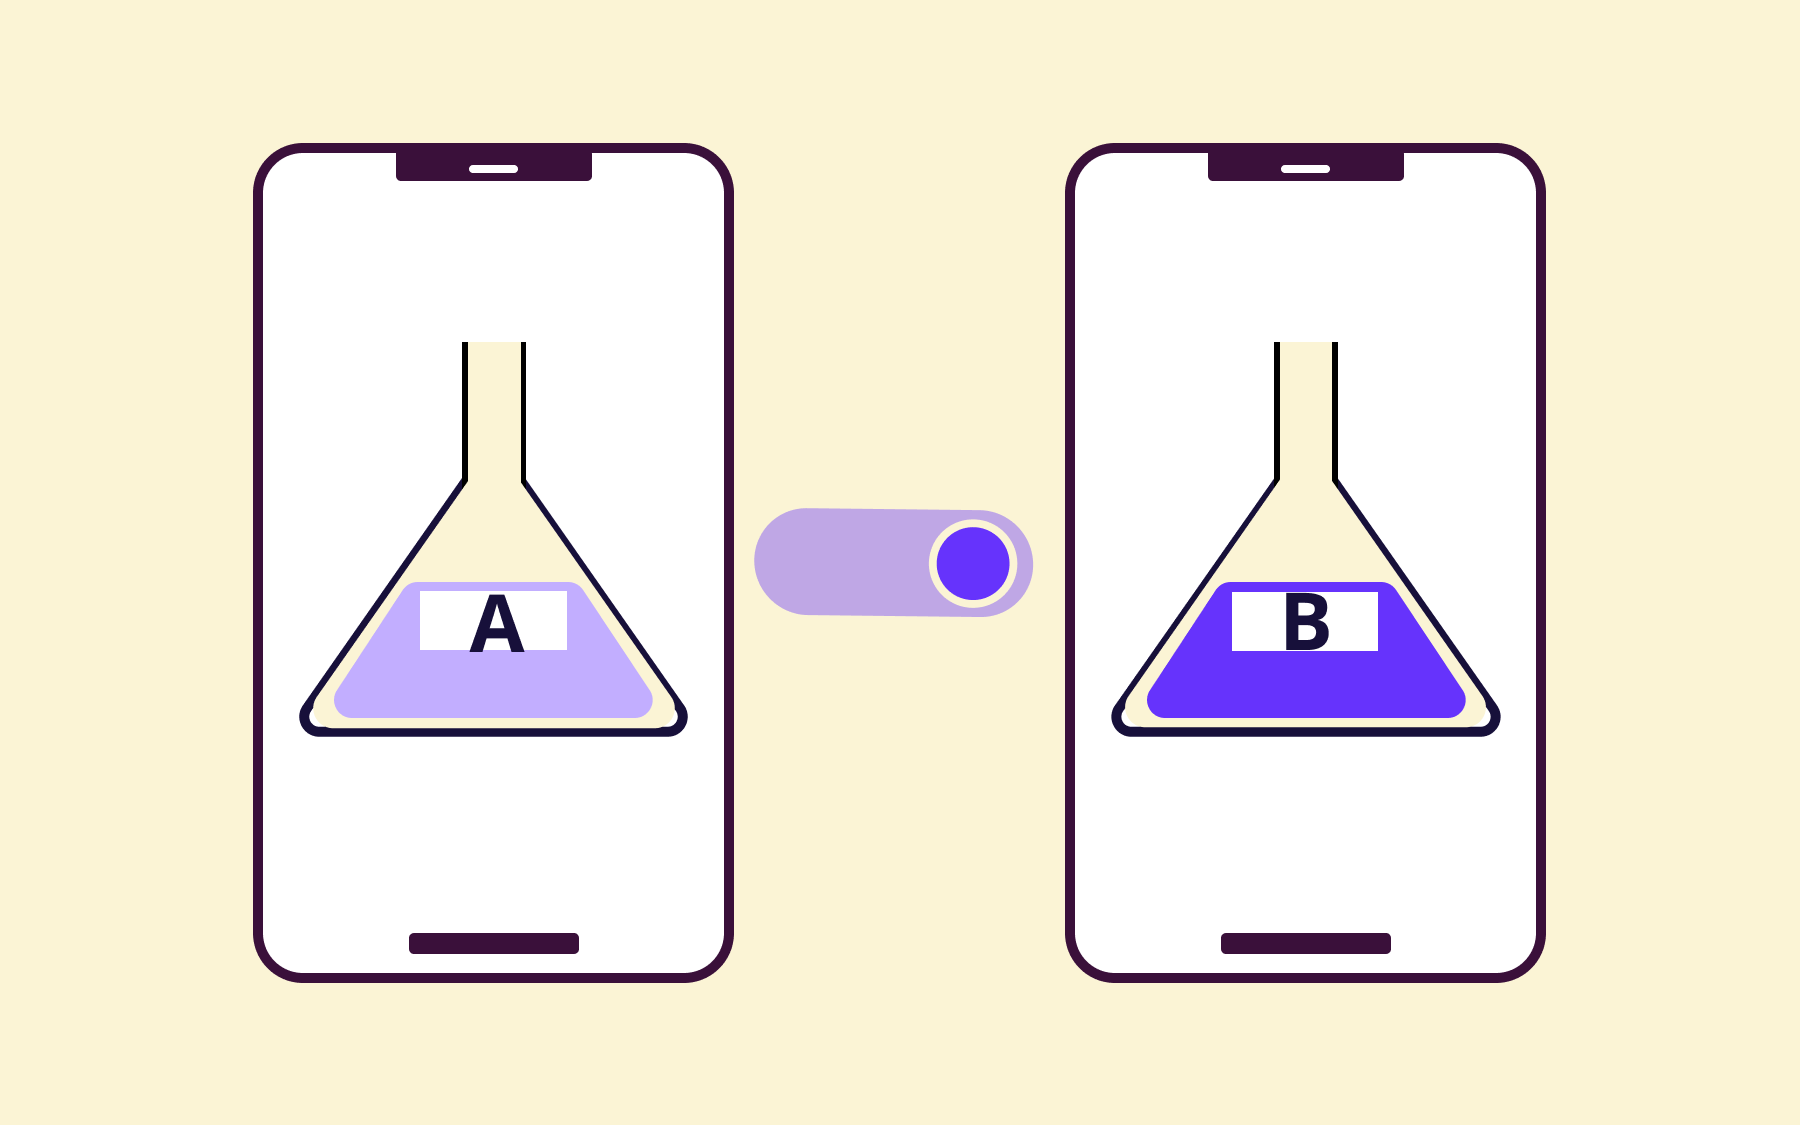
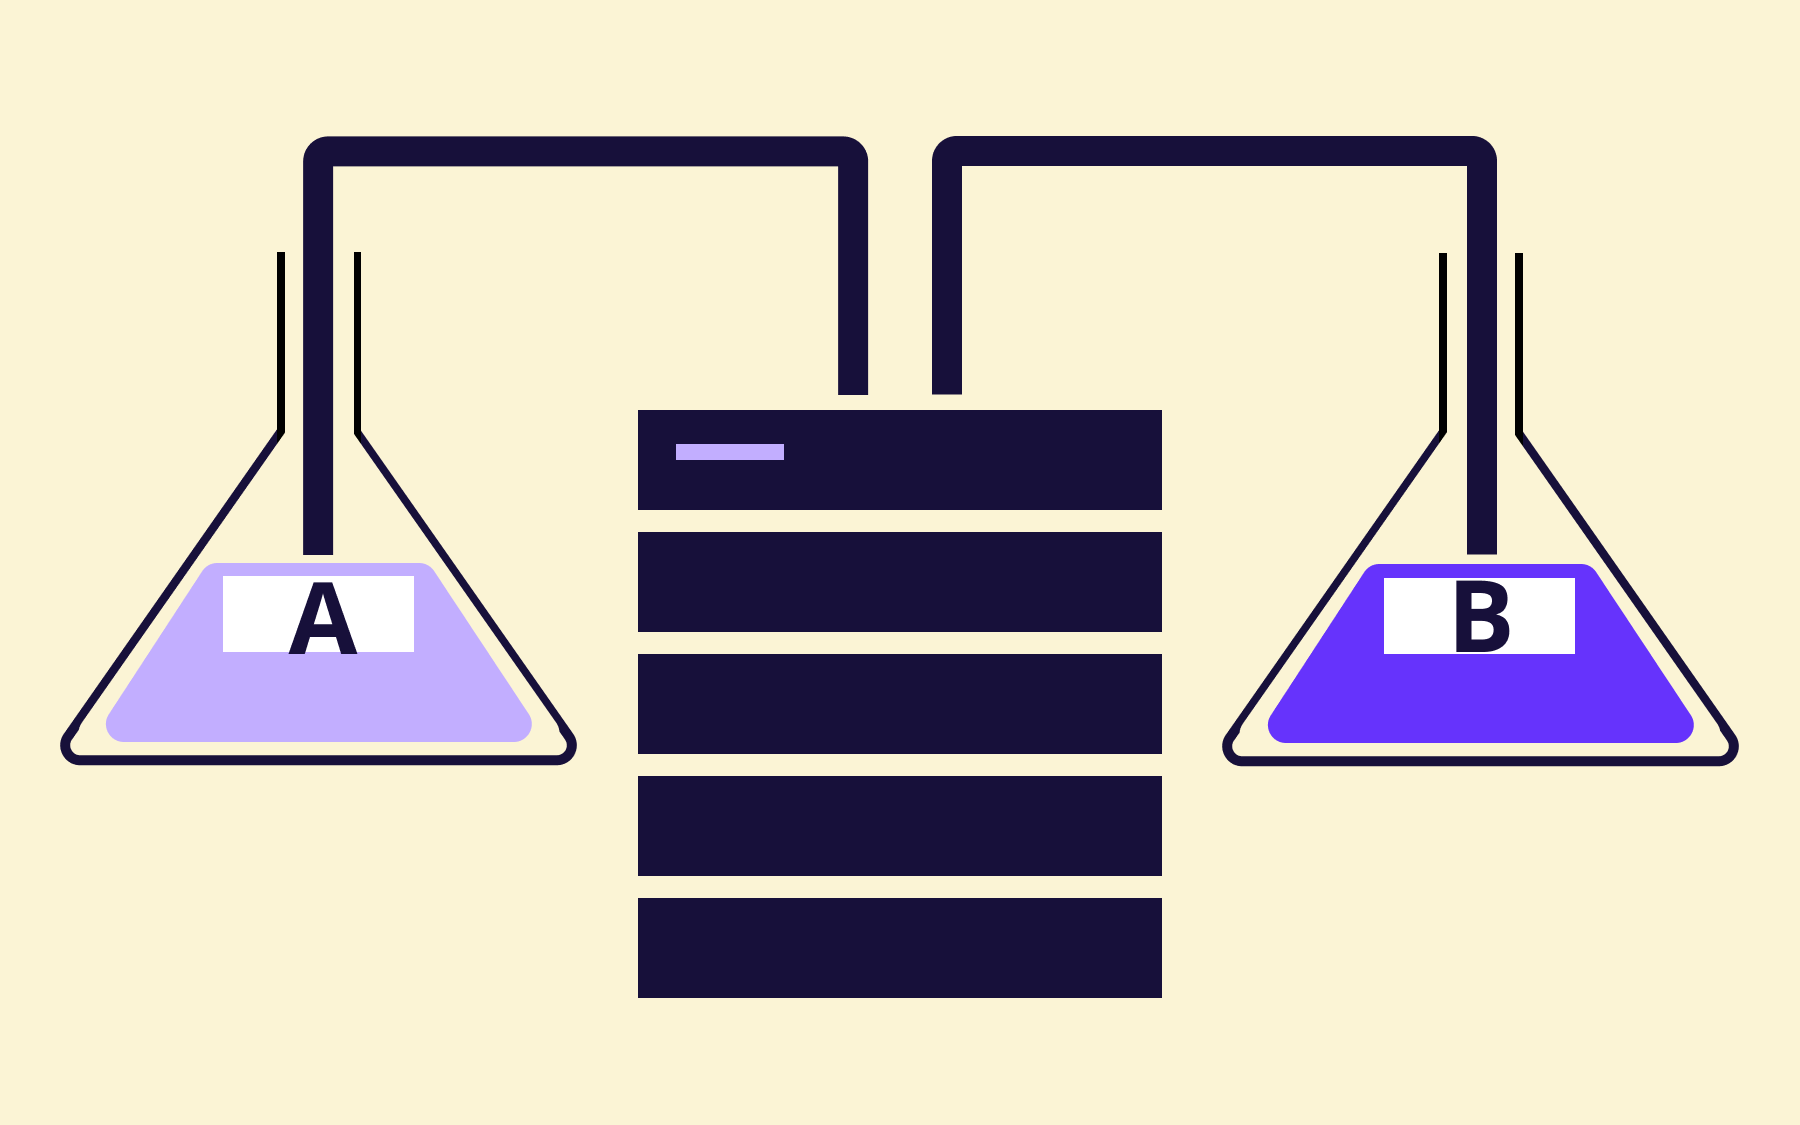
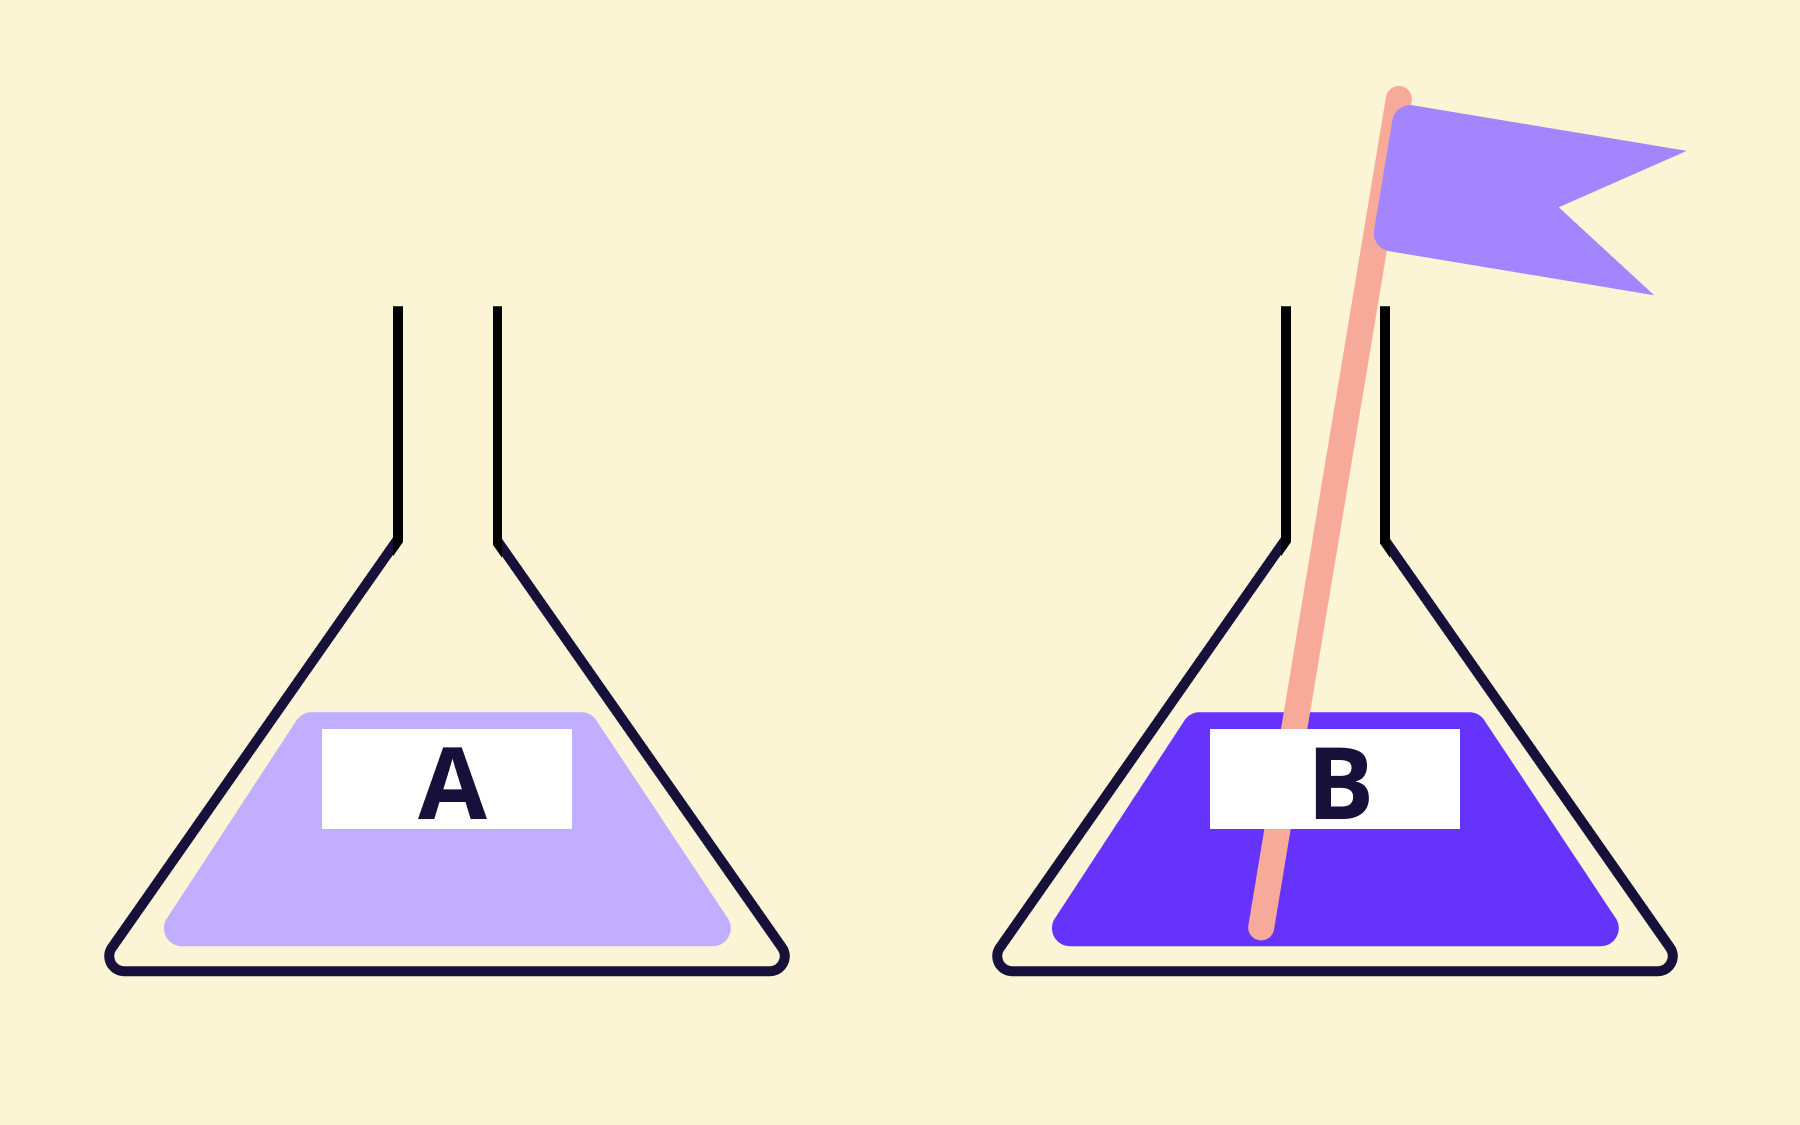
When you run an A/B test, you show one group of users version A of something—a page, a feature, an email, a user interface—and another group version B, then measure which one moves the key metric you've identified for the test.
It sounds simple, but there are plenty of ways you can get it wrong, such as peeking at results too early, testing the wrong metric, or building the test in a way that breaks the data before you even collect it.
This guide covers what A/B testing is, how it differs from multivariate and split testing, the process for running an effective A/B test, and what engineering teams need to know—like sample ratio mismatch and the choice between client-side and server-side testing.
What is A/B testing?
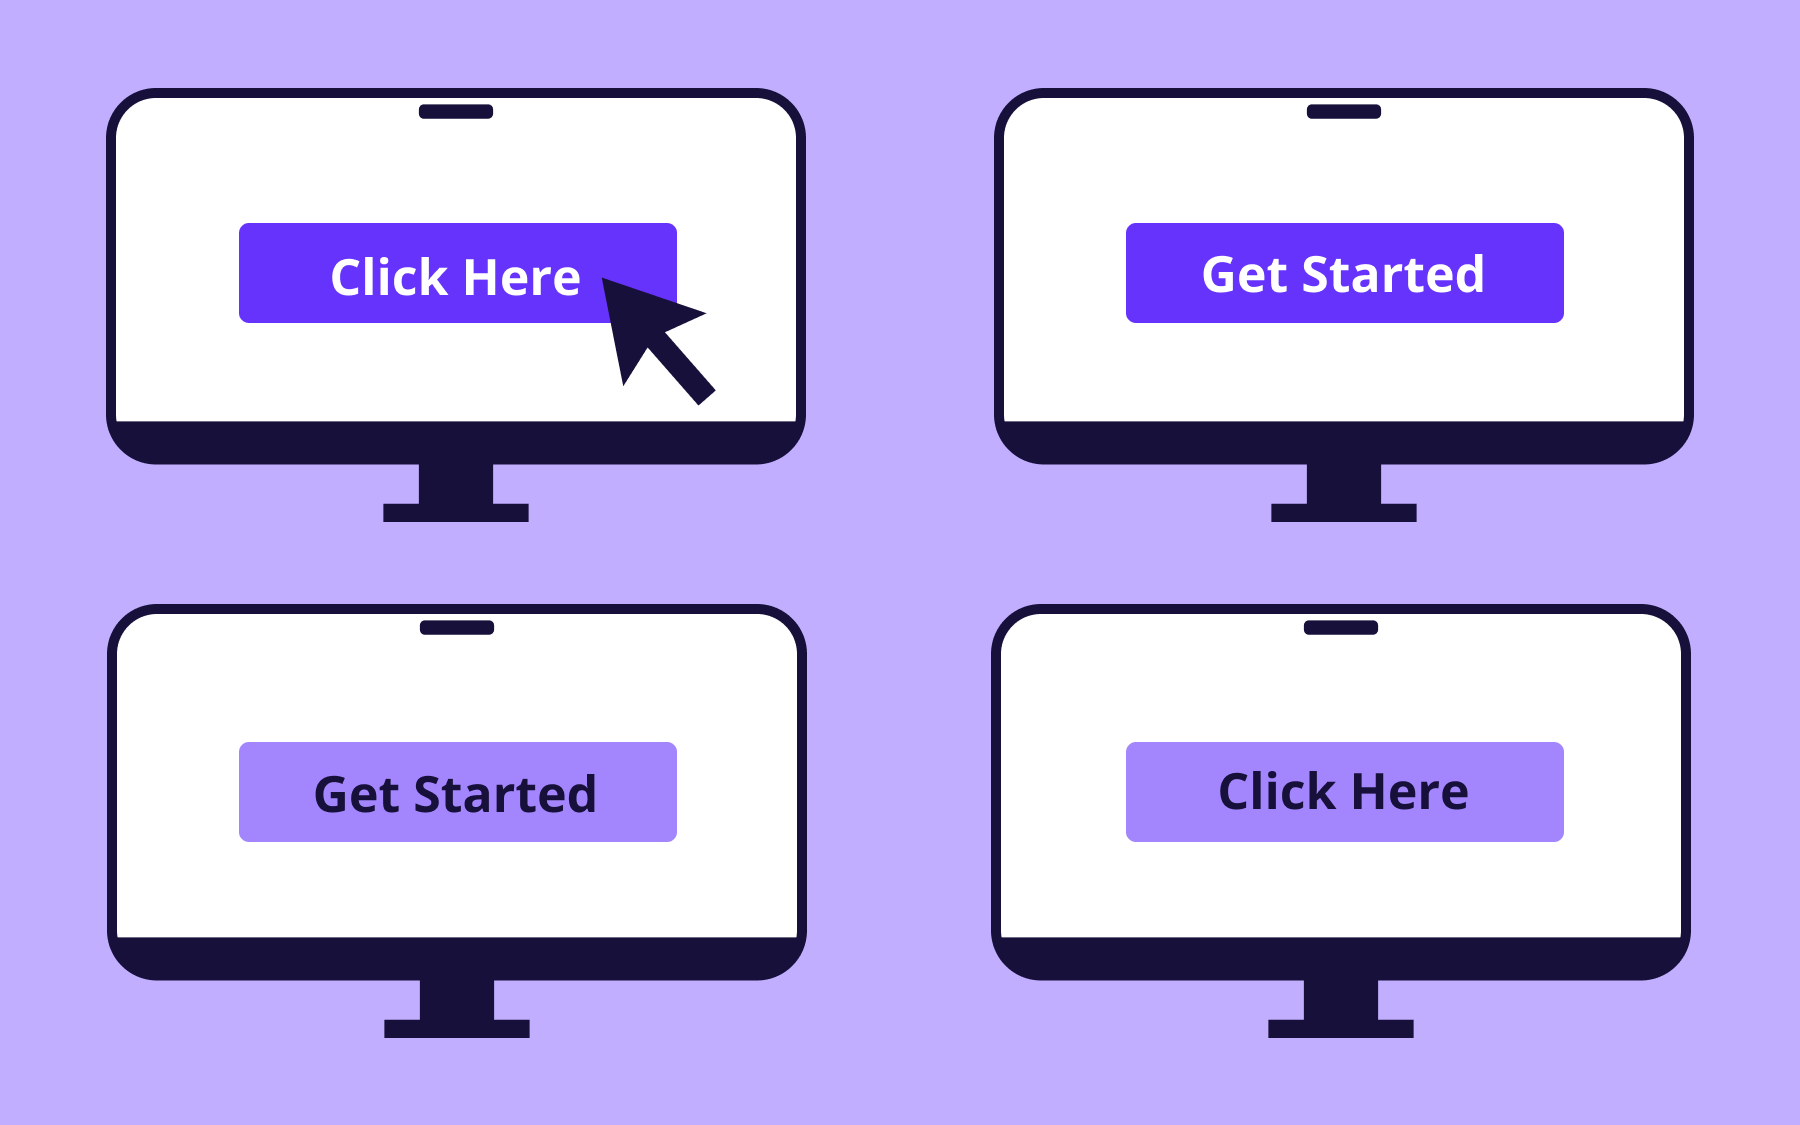
An A/B test is a controlled experiment that compares two versions of the same page, feature, element, or message to see which one performs better against a defined metric. One group of users sees the original, called the control, and another sees the changed version, called the variant. Everything else stays the same, so any difference in results between versions A and B can be attributed to the one thing you changed.
Before you start, you need to agree a few key details:
- Hypothesis – A specific, testable prediction. An example would be that changing the sign-up button from grey to green will increase clicks.
- Primary metric – The single number you're using to judge success, like conversion rate or average order value. You can track secondary metrics too, but the primary metric decides the outcome.
- Sample size – How many users need to go through the test before the result can be trusted.
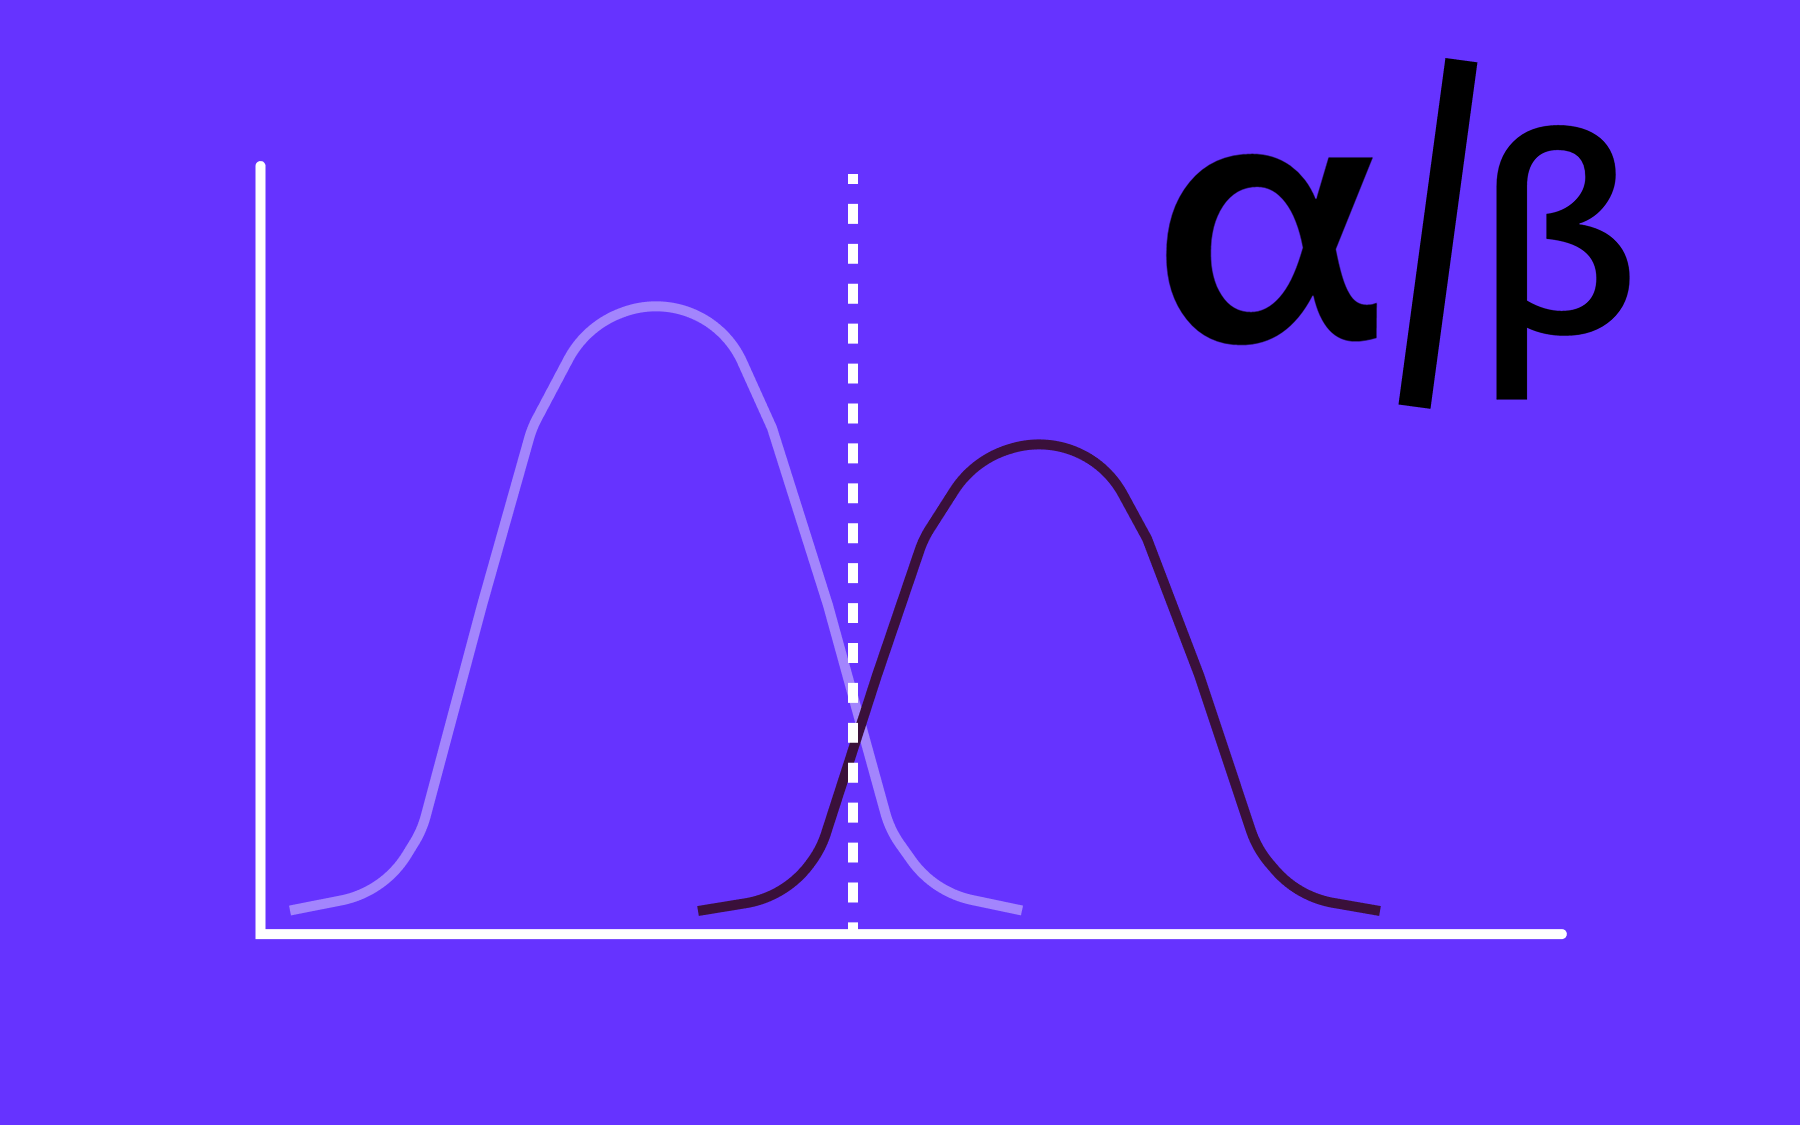
- Statistical significance – a measure of how likely it is that the difference you're seeing is real, rather than down to chance.
- Guardrail metrics – Key metrics that you aren't testing against, but you don't want your test to impact.
What makes A/B effective is the fact that it isolates a single variable. Change the button colour and the headline at the same time, and a win tells you the combination worked, but not which update had the impact.
Most A/B tests assess quantitative data: click-through rates, conversion rates, revenue per visitor, and other numbers you can run statistical methods against.
Qualitative data—session recordings and support tickets, for instance—doesn't decide a test on its own, but it can be used to generate a solid hypothesis. Usability testing with a handful of real users can surface the friction point long before you've committed engineering time to a full experiment.
A/B testing vs. multivariate testing vs. split testing
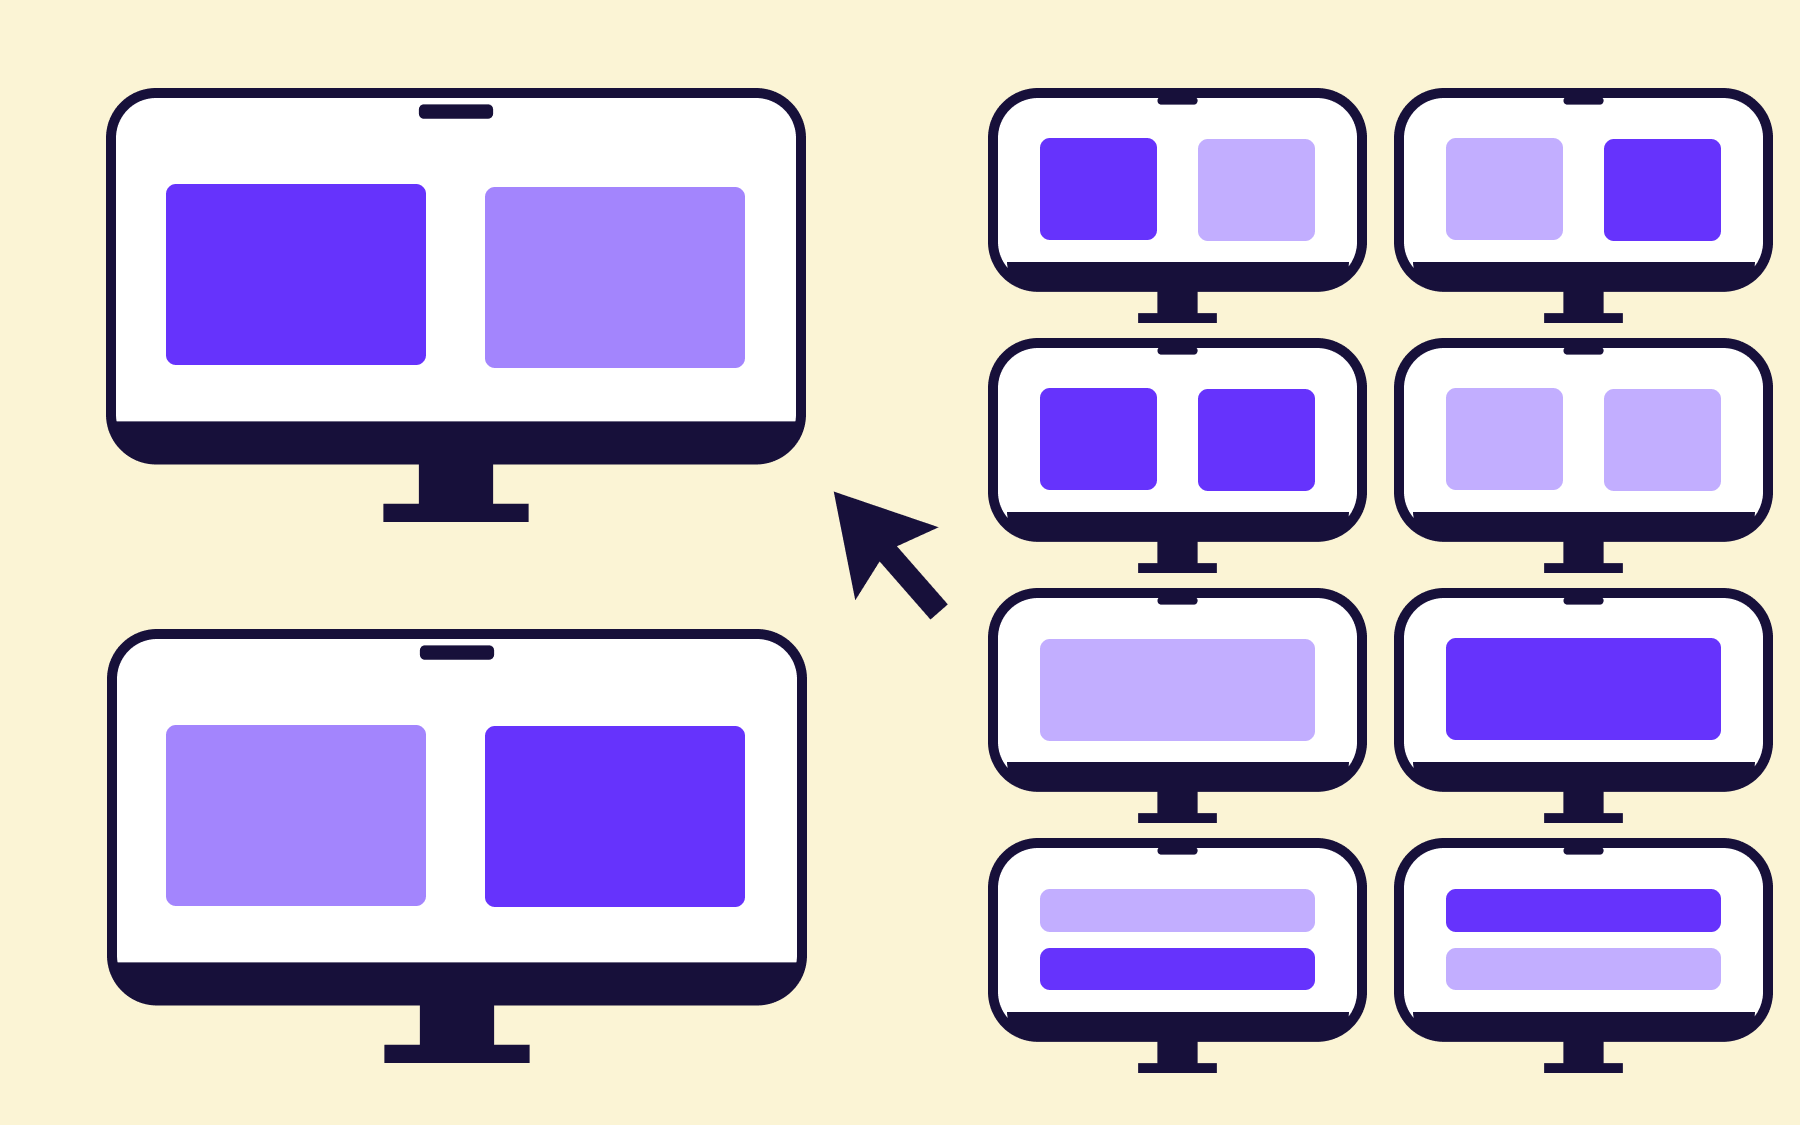
A/B testing, multivariate testing, and split testing often get confused, but they describe different things, and by mixing them up you risk wasting your time on an inconclusive test, or one with deceptive results.
Split testing is often used as a synonym for A/B testing, and in casual conversation, it usually is one. Where the two diverge is in their scope: split testing refers to testing entirely different page designs against each other, sometimes via split URL testing, rather than, in A/B testing's case, a single changed element on the same page.
Multivariate testing assesses multiple elements at once—such as a headline, an image, a call-to-action button, and the surrounding colour scheme—and every combination of them.
Testing every combination tells you which one performs best, though a multivariate test needs considerably more traffic than a standard A/B test: splitting visitors across every combination leaves fewer of them in each group. If you don't have the traffic to reach statistical significance across all those combinations, you'll end up with an inconclusive test regardless of how interesting the questions are.
Use A/B testing when you want a clean answer about one change, and save multivariate testing for when you have the traffic to support it and a strong hypothesis about how elements interact.
How A/B testing works
Every A/B test follows the same statistical logic, even when the tool or the team running it changes.
You start with a hypothesis and a primary metric, then split your users randomly into two groups. Thanks to this randomisation, you can assume the two groups are otherwise identical, so any gap in results is down to the change you made rather than some difference between the groups.
You then run the test until you reach your predetermined sample size, and check whether the result is statistically significant at your chosen confidence level—95% is the common default, meaning there's roughly a 5% chance the result you're seeing is a false positive.
Stopping early, before you hit that sample size, is one of the most common mistakes teams make, where they make a conclusion based on partial data. A test that looks like a clear winner on day two can easily flip by day ten, once enough data has come in to smooth out early noise.
Before you run anything, it's worth calculating your minimum detectable effect: the smallest improvement you'd actually consider worth acting on. If your traffic is low and you'd only detect a 20% lift with any confidence, but you're hoping to catch a 3% improvement, the test isn't set up to help you get the data you need.
Sample ratio mismatch and other test-killers
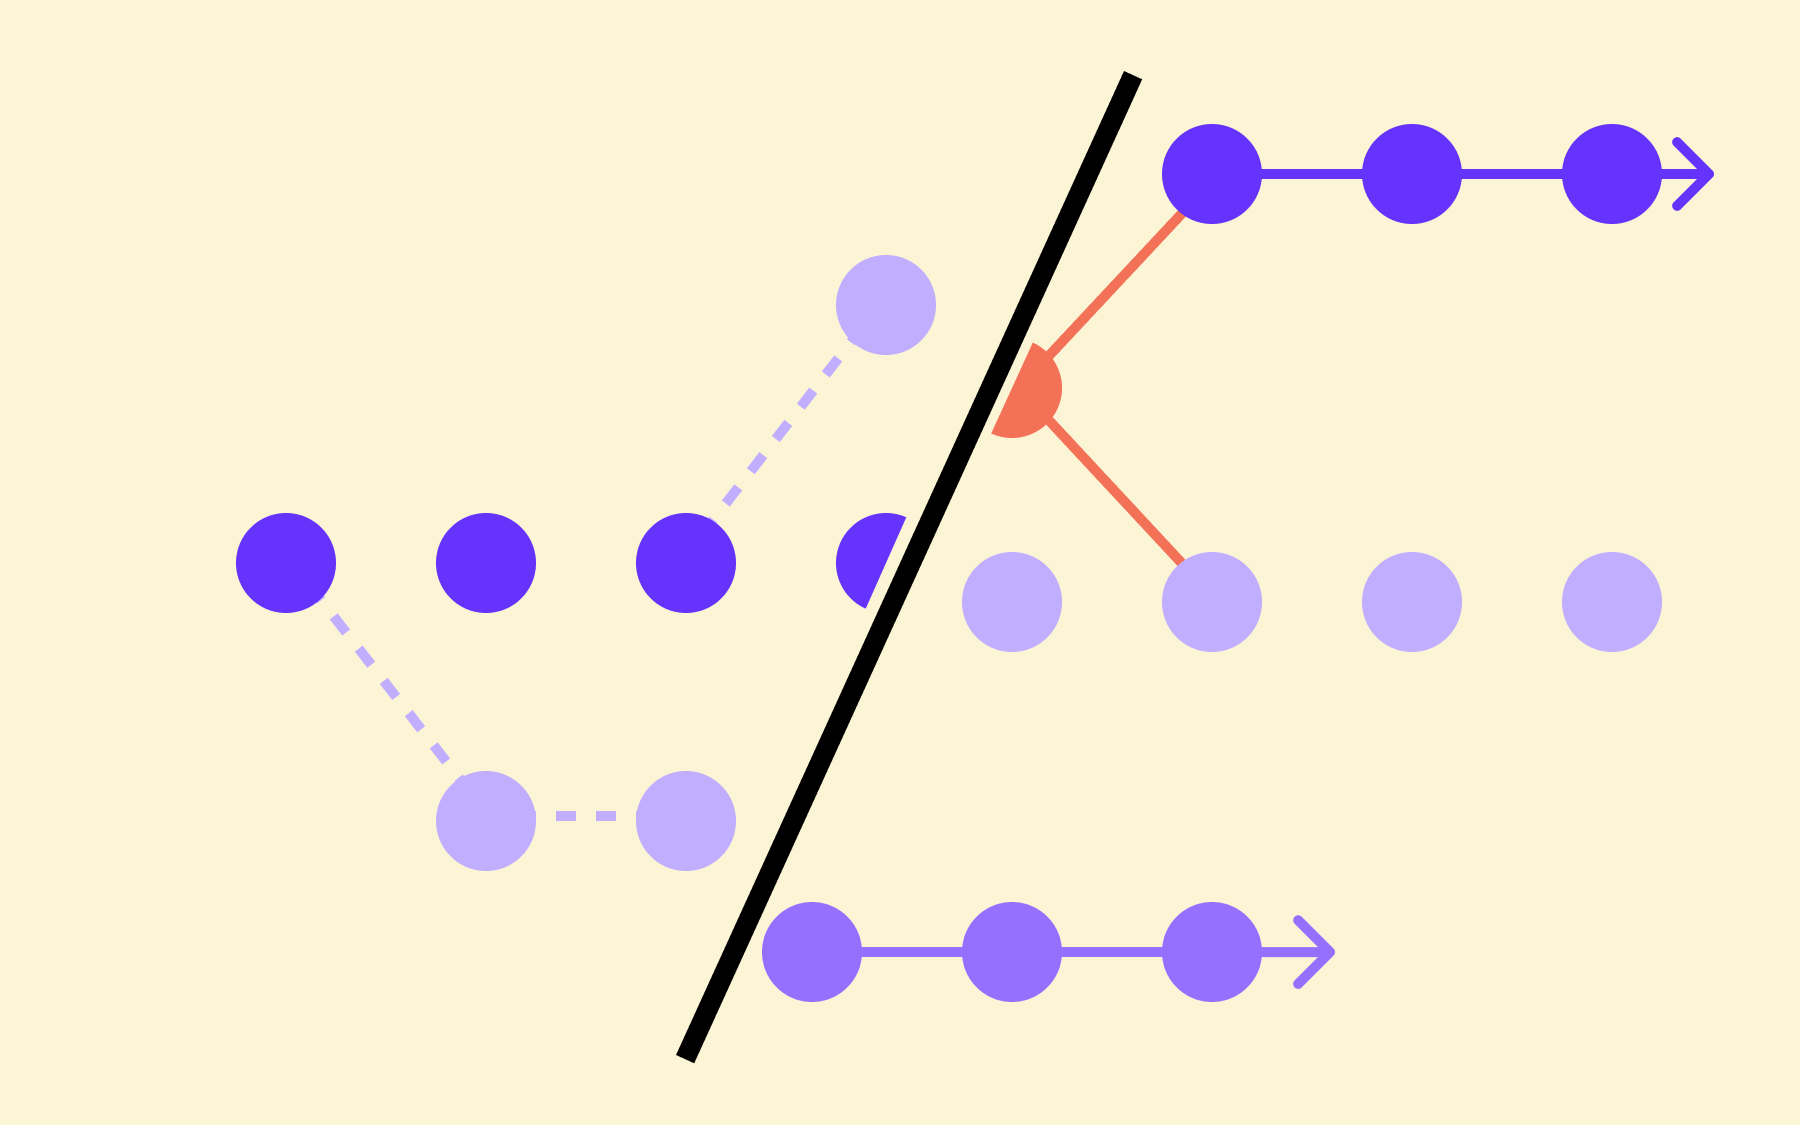
Sample ratio mismatch (SRM) is one of the more common ways a test produces garbage without anyone realising. It happens when the traffic split between your control and variant doesn't match what you configured—your test is set to 50/50, but the actual split comes out at 54/46 or worse.
A skewed ratio like that usually means something is wrong with how users are being assigned to groups, rather than that one variant is somehow attracting more visitors.
Common causes include:
- Bucketing bugs – A redirect, caching layer, or bot-filtering rule that treats one variant differently before assignment happens.
- Broken randomisation – Assignment logic that isn't actually random, for example, it's tied to something correlated with user behaviour.
- Bot and crawler traffic – Automated traffic that isn't evenly distributed across variants, skewing the numbers.
- Client-side load failures – A variant's script fails to load for a subset of users, silently dropping them from that group.
You can check for SRM with a simple chi-squared test comparing your actual split against your intended one. If a test comes back with any of these red flags, treat the results as unreliable until you've found and fixed the cause, however tempting the headline number looks.
How to run an A/B test
Running a test properly follows a consistent process, whether you're testing a marketing page or a piece of backend logic.
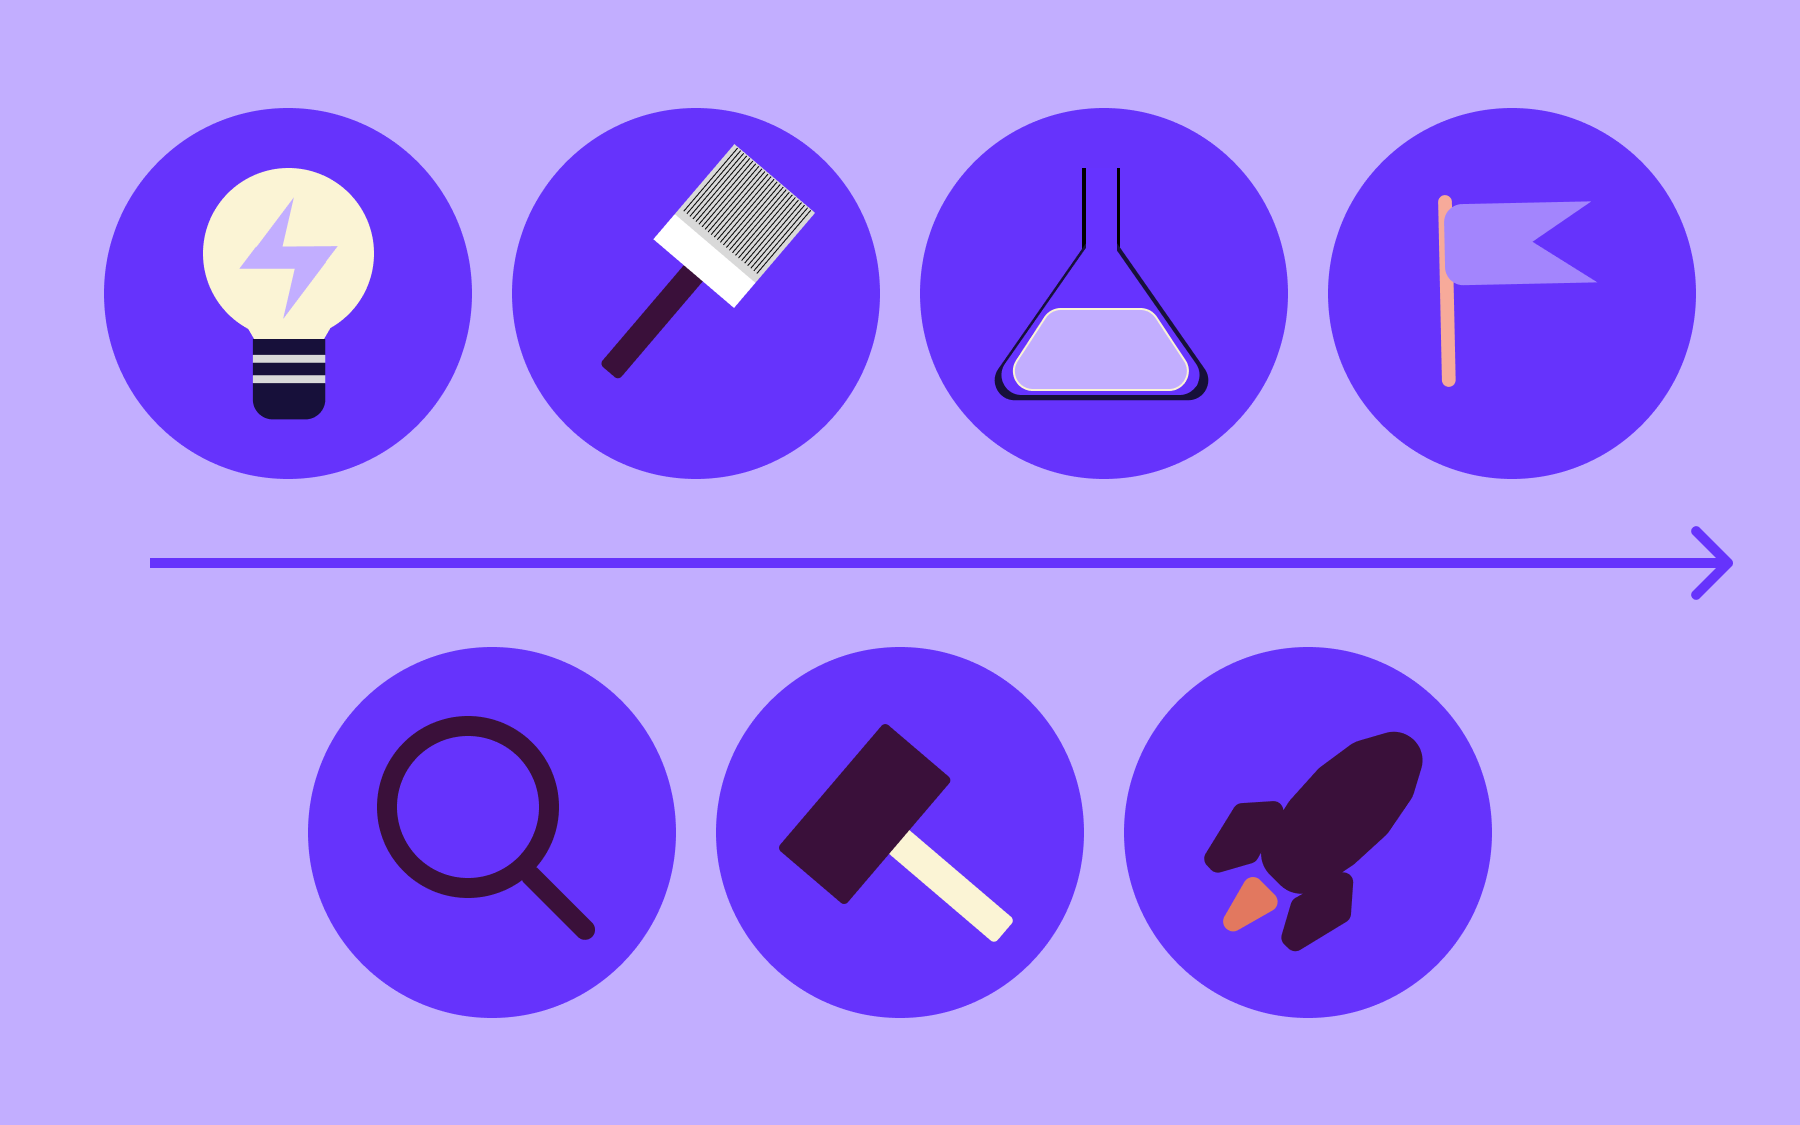
- Identify a problem worth testing. Start from a real drop-off point or underperforming metric, not just an idea someone liked. Look at existing data, such as funnel drop-off points or support tickets, to find where actual user behaviour diverges from what you expected.
- Write a specific hypothesis. State the change, the expected effect, and the reasoning, so you can judge the result against the belief that led to the test rather than reinterpreting the data after the fact.
- Choose a primary metric and calculate sample size. Decide what a "win" is before you start, and work out how many users and how much time you need to detect the effect size you need for that "win".
- Build and QA both versions. Make sure the control and the variant are functionally identical except for the one thing you're testing, and check the experience on both before it goes live to real users.
- Run the test for a full business cycle. A week is usually the minimum, so the test captures weekday and weekend behaviour rather than a skewed slice of it. Longer-consideration purchases or B2B products may need several weeks.
- Analyse the results properly. Check for statistical significance and watch for sample ratio mismatch. Then look at your secondary metrics for anything the primary metric might be masking.
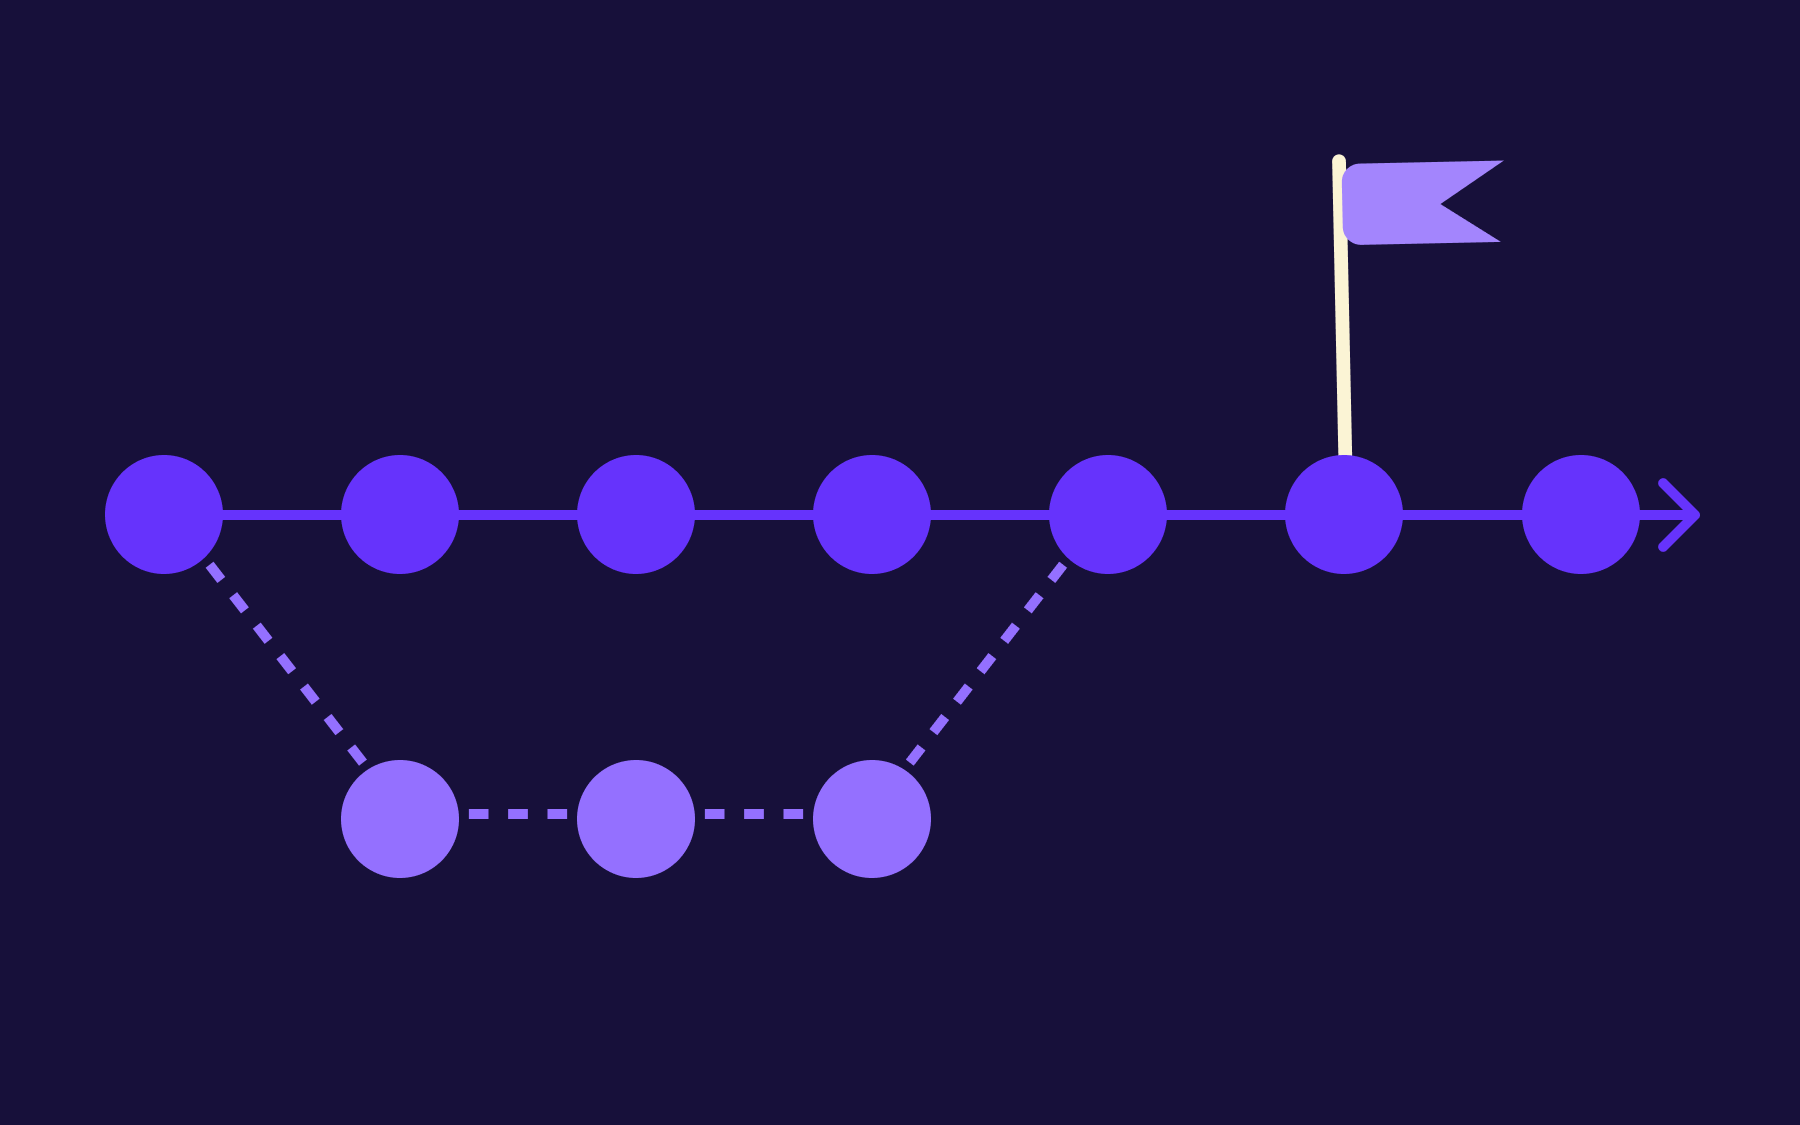
- Roll out, iterate, or roll back. A win gets shipped to everyone. A loss gets documented and set aside so nobody re-runs the same test in a year, having forgotten it was already proven wrong.
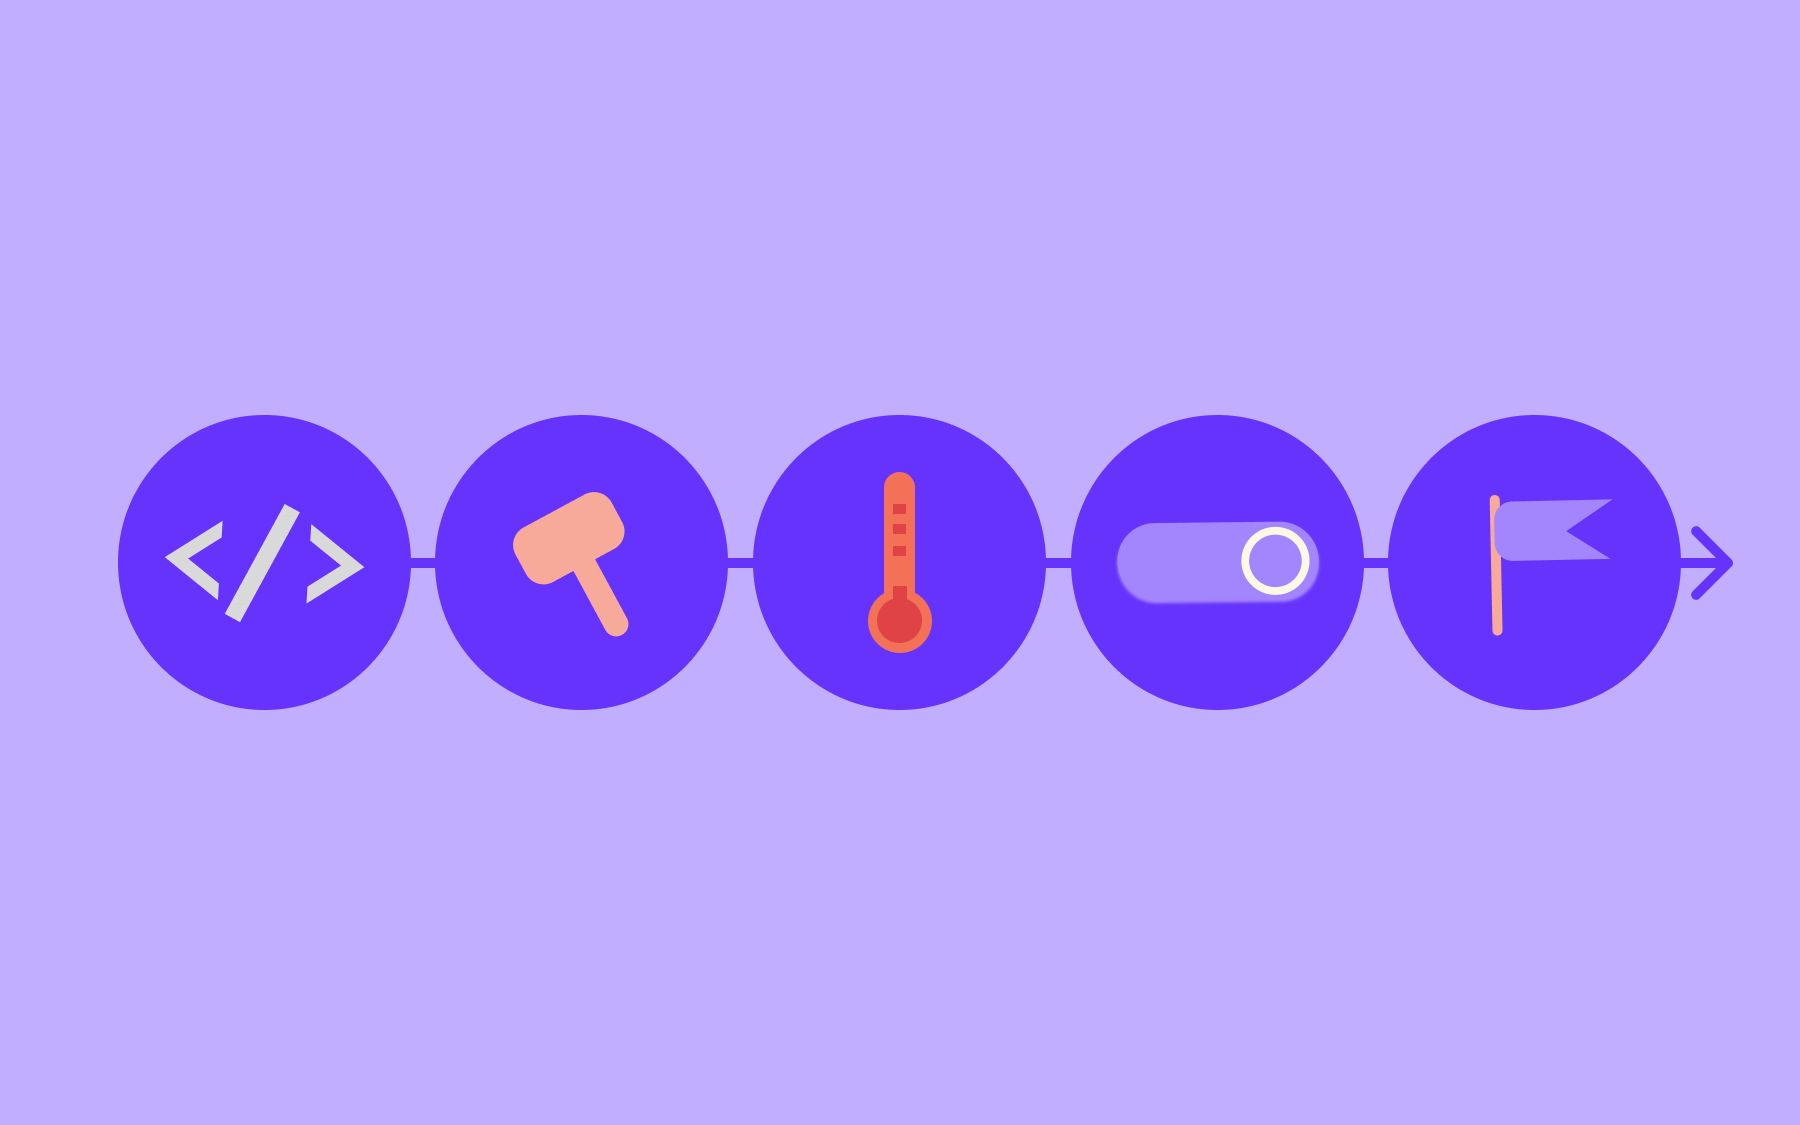
You may have realised that a lot of engineering effort goes into the "build and QA both versions" step of the process. It's also where you need feature flags.
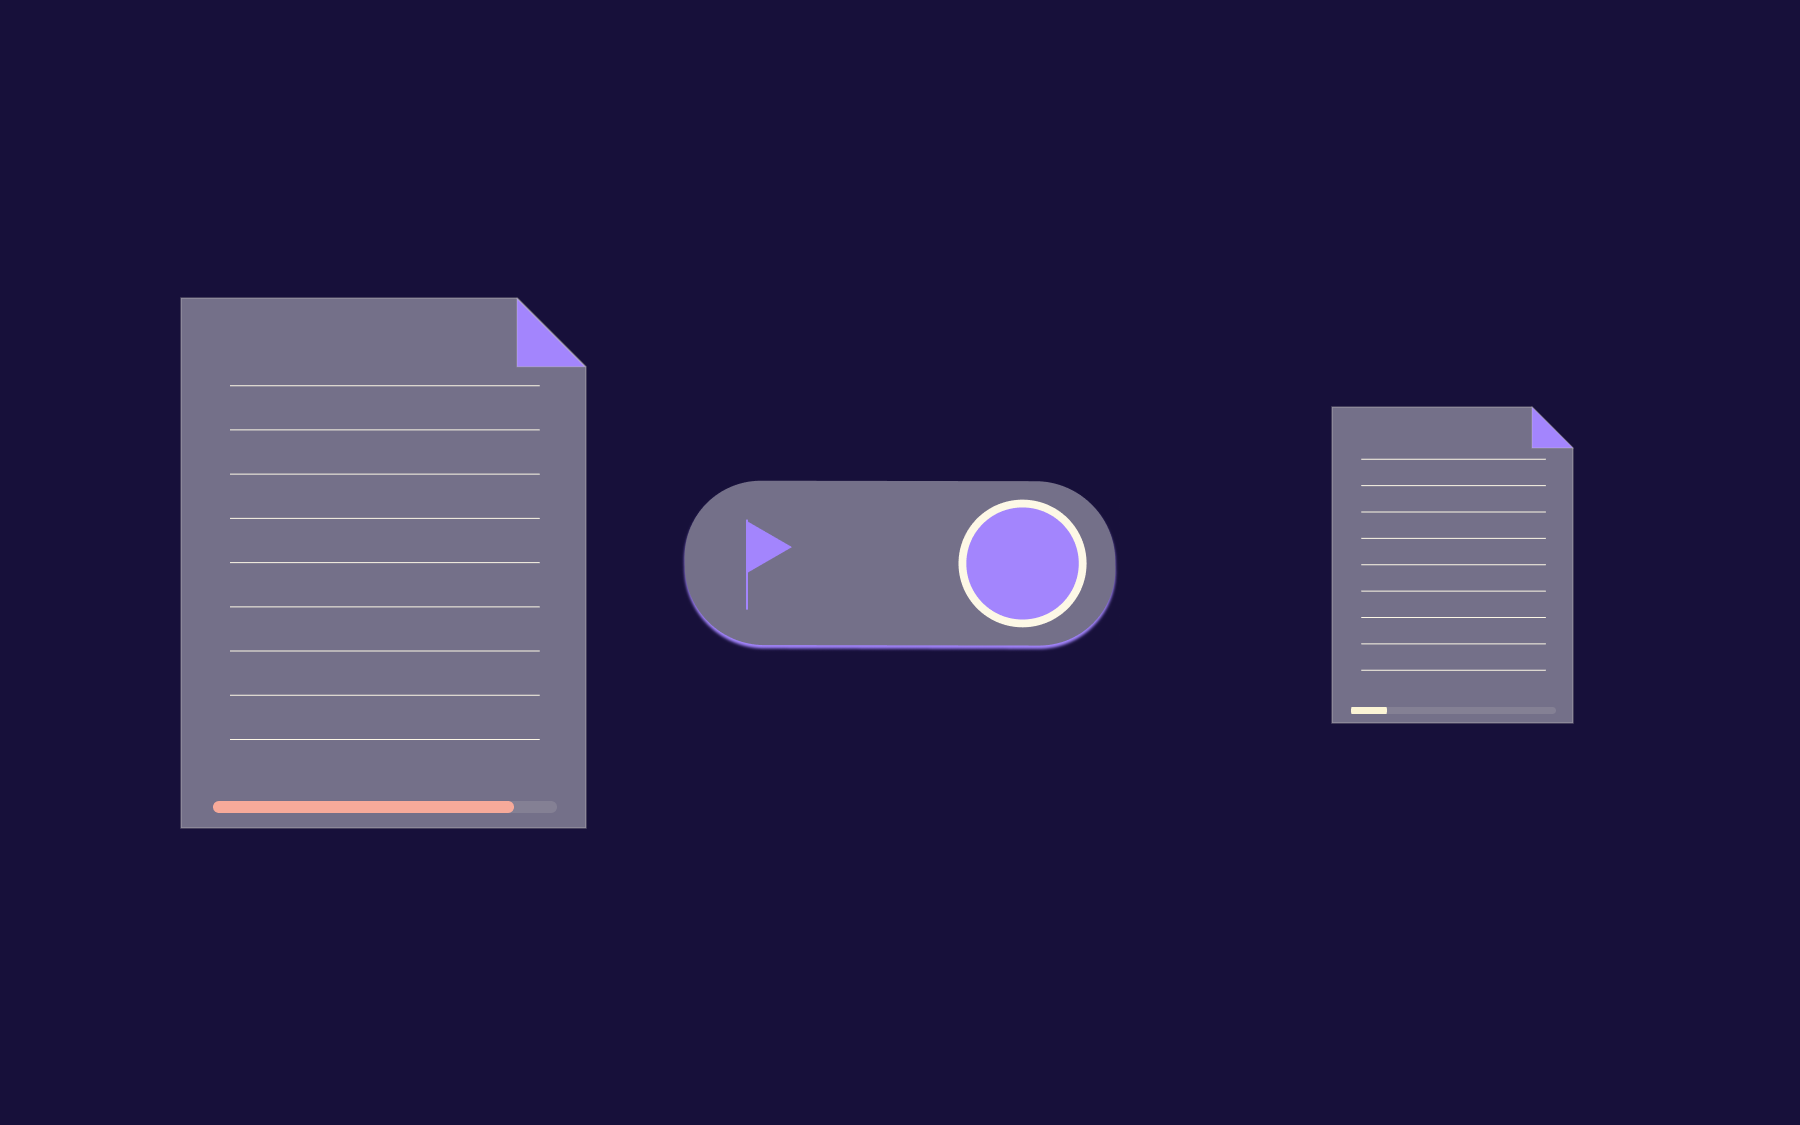
Rather than maintaining two parallel code paths by hand, you can wrap the variant in a toggle using a feature flag, control what percentage of traffic sees it, and turn it off instantly if something goes wrong, without needing a new deployment.
Client-side vs server-side A/B testing
Where you run your experimentation changes what you can test, how fast you can ship it, and what it costs you in performance and risk.
Client-side testing is quick to set up and doesn't need engineering time for every change, which is why marketing teams favour it for landing pages and email subject lines.
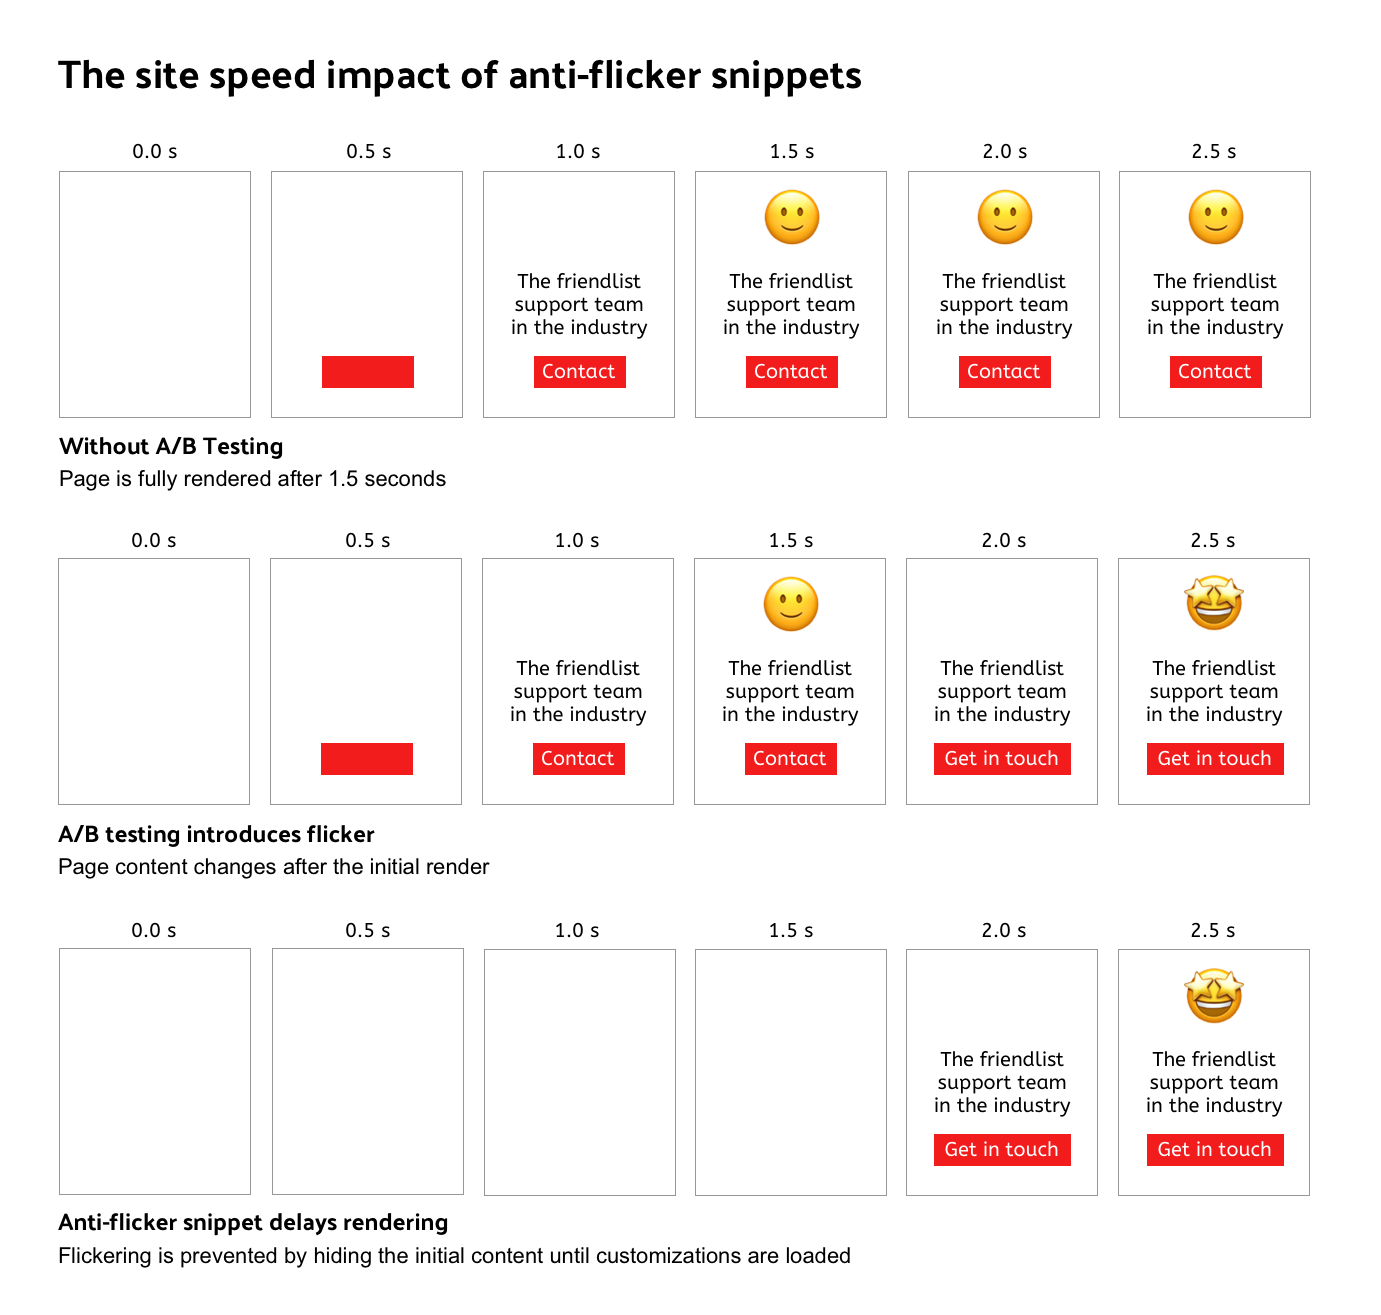
However, these tests are susceptible to the flicker effect, where users briefly see the original page before the test script swaps in the variant. They can also be hit by page-load performance issues due to the test running an extra script on every visit.
In an independent audit by DebugBear, removing an anti-flicker snippet that was hiding a homepage while a test script decided which variant to show cut the page's Largest Contentful Paint from 6 seconds down to 2.7 seconds.
Server-side testing avoids both problems because which variant is shown is decided before anything reaches the browser. It suits changes to pricing logic, recommendation algorithms, or anything you don't want exposed in client-side code, but it needs a development team to implement each test rather than a marketer dropping in a visual editor.
Feature flags are useful tools in server-side testing, giving you a single control point in the code, evaluated on the server, that decides which variant a given user gets—no separate testing script, no flicker, and an instant kill switch if the variant starts to misbehave.
An A/B testing example
Say a product team notices that a meaningful share of users abandon a multi-step sign-up form on the second step, where they're asked to fill in company details before creating an account.
The hypothesis: moving the company-details step to after account creation, so users get access to the product first, will increase the number of people who complete sign-up.
- The primary metric is sign-up completion rate.
- The secondary metric is time to first login, to check whether the change also affects how quickly people start actually using the product.
The team builds the reordered flow behind a feature flag, splits new visitors 50/50 between the original order and the new one, and runs the test for two full weeks to cover a complete business cycle.
At the end of the test, the reordered flow shows a statistically significant improvement in sign-up completion, with no meaningful change in time to first login.
Before they had an assumption; now the team has a measured result and understands what users want. They roll the new order out to all users and update their onboarding documentation to match.
Running A/B tests without a dedicated experimentation platform
If you have only a handful of tests to run, you may see no point in buying a full experimentation platform. A workable alternative is to combine two things you may already have: a way to assign users to variants, and an analytics tool to measure what happens next.
A feature flag with a percentage split decides which variant each user sees, and your existing analytics platform—Google Analytics, Amplitude, Mixpanel, or a data warehouse you already query—collects the events and tells you which variant won.
You don't need to acquire and onboard a new reporting layer or migrate your data anywhere; you're using the flag purely as the bucketing mechanism and letting your current tools do the analysis.
Flagsmith can help you create a multivariate flag, define your variations and the percentage split between them, and send the resulting flag values to Amplitude, Mixpanel, or any other analytics platform as event properties.
There's also a native Experimentation feature that adds a managed data warehouse and a built-in statistics engine for teams that want the analysis handled for them.
The self-managed approach—flags plus your own analytics stack—remains fully supported for everyone else. You can read more about testing with feature flags in Flagsmith's documentation.
Bear in mind that this approach doesn't come with the automated statistical reporting, guardrail alerts, or pre-built dashboards that a dedicated experimentation platform bundles in.
If your team is running dozens of overlapping tests and wants built-in significance calculations and warnings, a purpose-built A/B testing tool is worth the cost. If you're running fewer tests and already trust your analytics tool, the DIY route avoids paying for a second reporting layer you don't need.
For a closer look at getting analytics-grade results this way, see how A/B testing works with feature flags and your existing stack.
How do I run A/B tests without hurting revenue?
Many A/B tests are designed to boost revenue, but they're still based on a hypothesis; theres always the risk that changing something on a key feature, even for 50% of users, will have a negative impact.
Thankfully, there are steps you can take to minimise that impact.
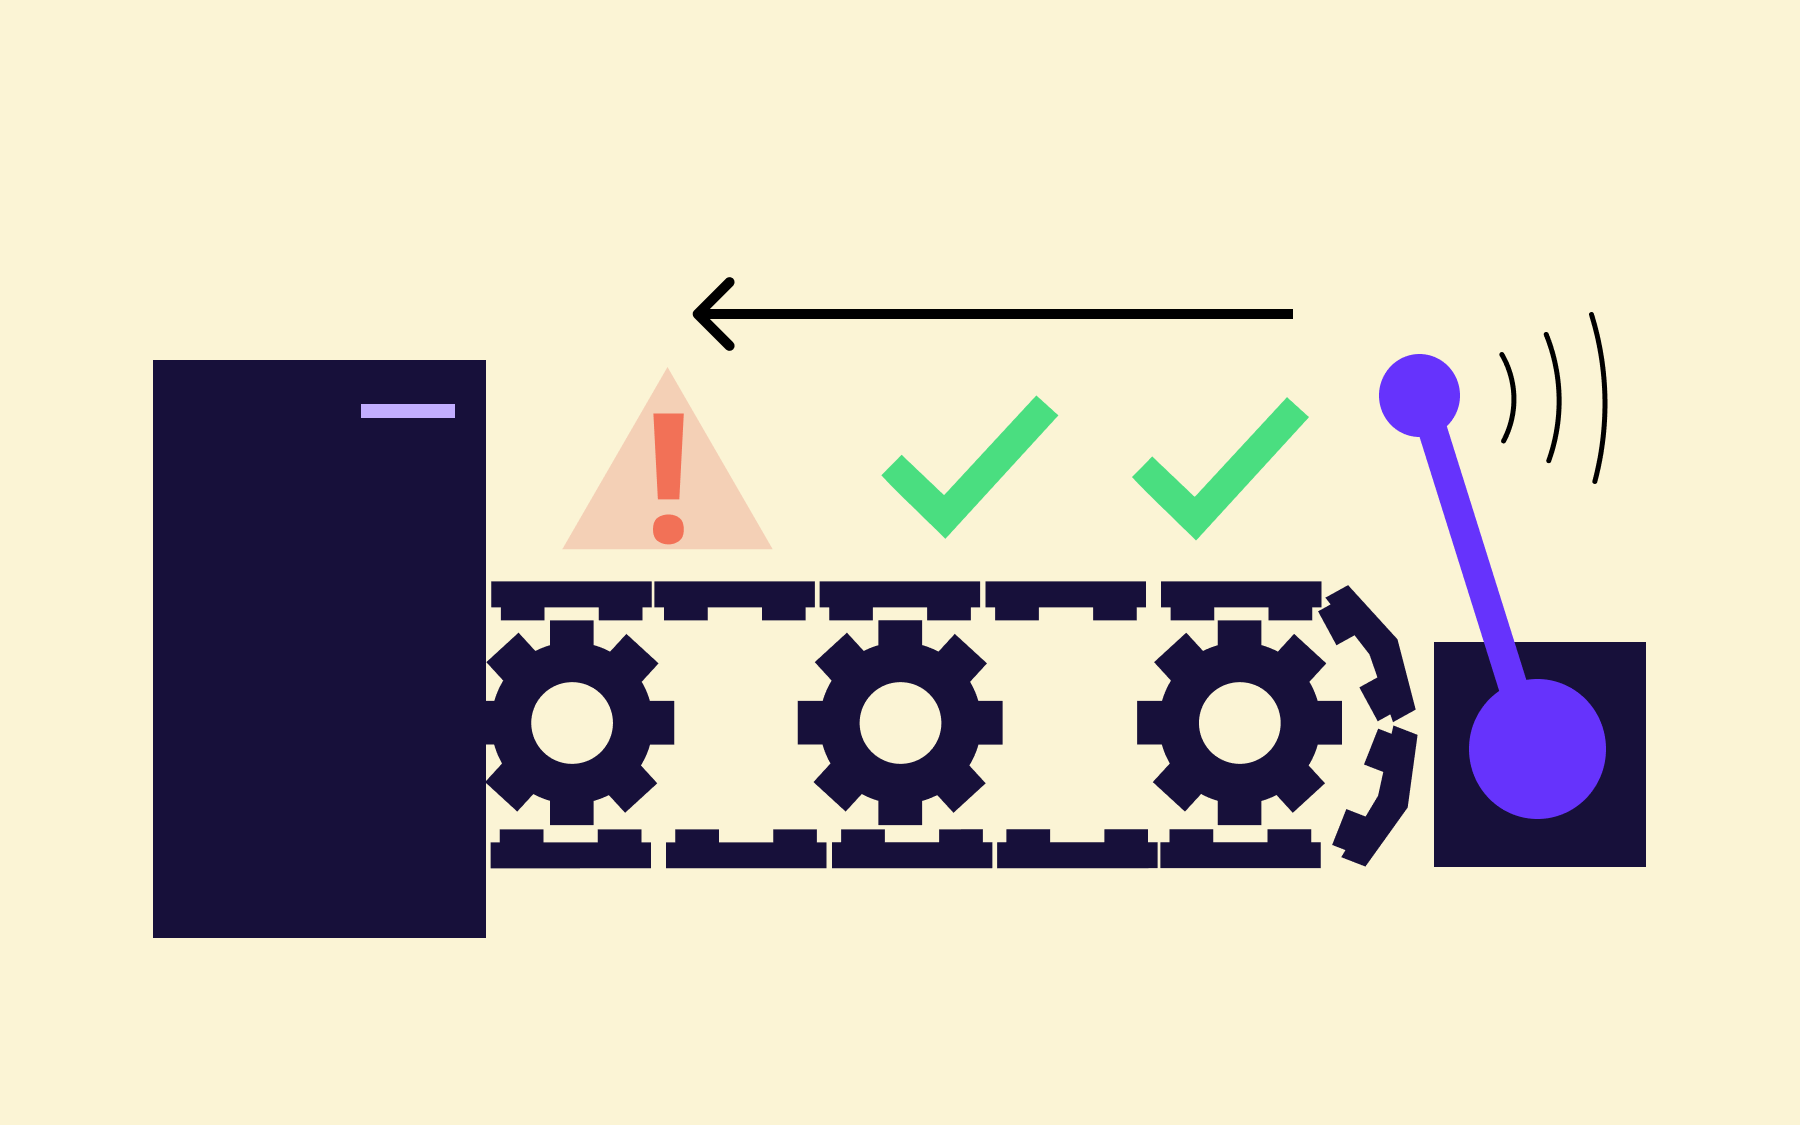
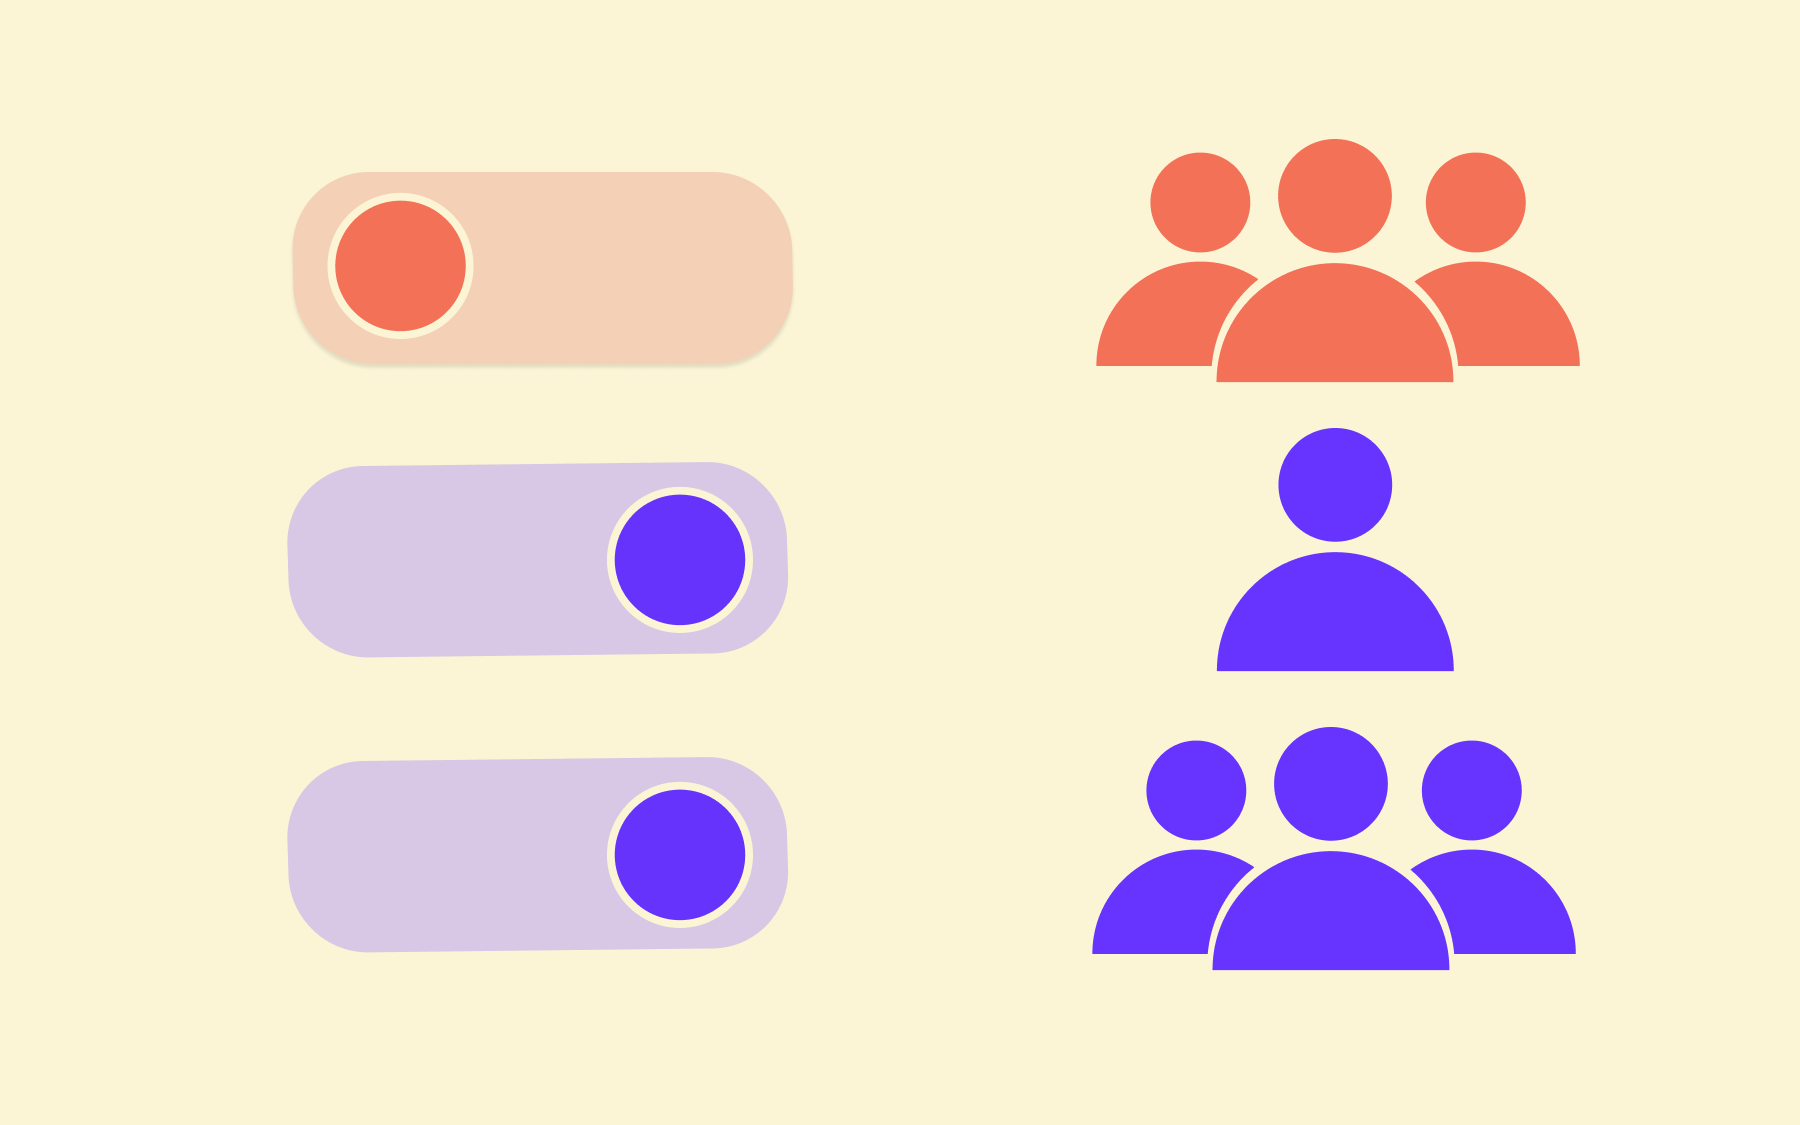
- Ramp exposure gradually instead of splitting 50/50 from day one, and set guardrail metrics like revenue or error rate that halt the test automatically if they slip.
- Maintain an instant rollback path on top of that, so a bad variant never stays live longer than it takes to notice.
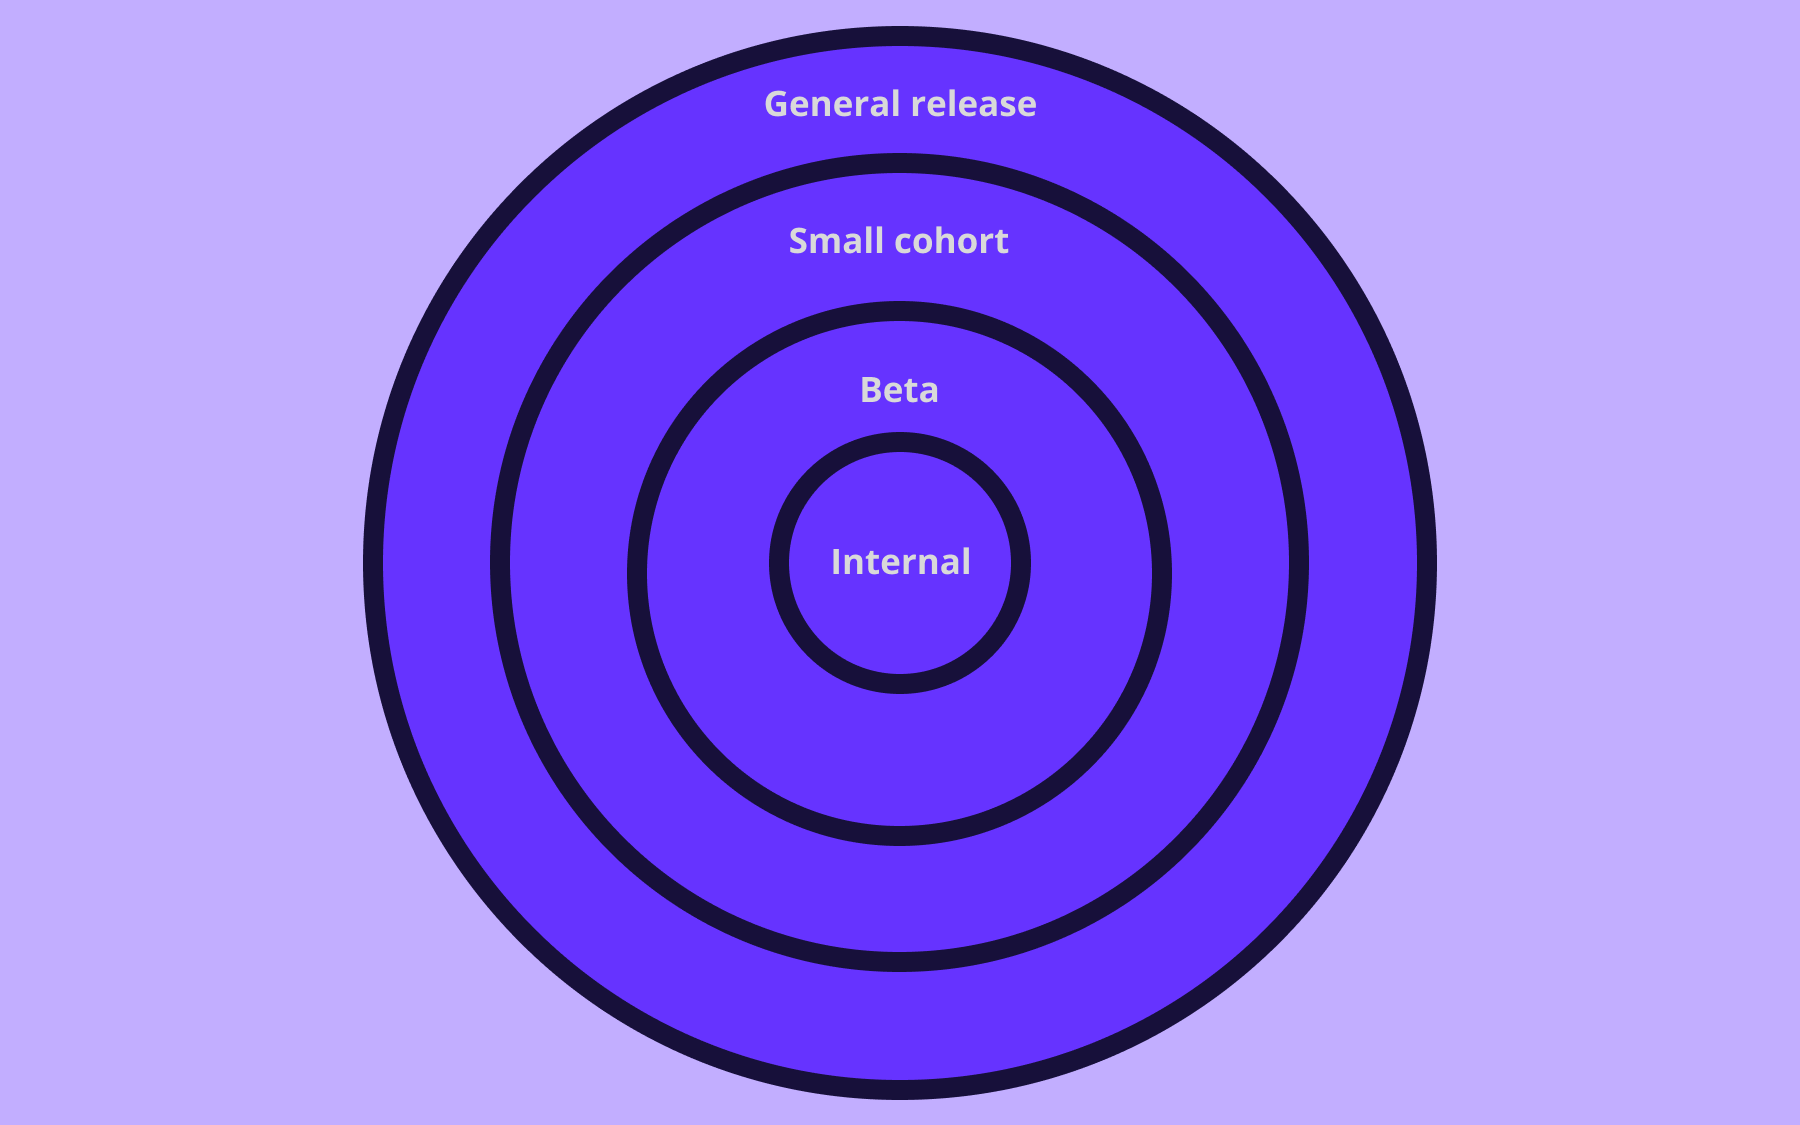
- Start a new test targeting a small percentage of traffic or users, such as 5–10%, and only increase it once early data shows no drop in your guardrail metrics. Keeping the initial split small limits your exposure if the variant turns out to hurt conversion rates or average order value, while still gathering enough data to reach a result.
- Ensure you have a kill switch. A feature flag gives you this by design—turning a variant off is a toggle, not a deployment—so if a guardrail metric moves in the wrong direction, you can pull the variant back to zero traffic in seconds rather than waiting for the next release window.
- Keep a real control group for the entire test, too. Without one, you can't tell whether a metric moved because of your change or because of something external, like a seasonal spike or a marketing campaign running at the same time.
Guardrail metrics are as important as your primary metric: a variant can win on click-through rate while quietly damaging revenue per user—something you only catch if you're watching for it deliberately, not just checking the number you hoped would move.
A/B testing best practices
- Test one variable at a time. If you need to test several, scope it deliberately as a multivariate test with the traffic to support it, rather than an A/B test that's quietly testing three things at once.
- Run for a full business cycle. Cutting a test short to hit a deadline can risk false positives sneaking into a report. External factors like paydays, weekends, promotions, and even the weather can all shift user behaviour on their own.
- Don't stop early. Checking results daily and calling the test the moment it looks significant will leave you with a result that doesn't hold up once you roll it out. Decide your sample size in advance and stick to it.
- Watch data quality, not just the headline metric. Sample ratio mismatch, bot traffic, and tracking bugs can all produce a confident-looking result that's actually broken. Check the underlying data before trusting the conclusion.
- Don't let the highest-paid person's opinion decide the outcome. The point of a test is to replace opinion with evidence. If a stakeholder overrules a losing result without new data, you've just gone back to relying on guesswork.
- Set a performance baseline before you start. Know your current conversion rate, bounce rate, average order value, and typical week-to-week swings going in, so a small shift after launch doesn't get mistaken for a test result when it's really just normal variation.
- Keep testing elements separate from your testing strategy. Which button, headline, or flow you test is a tactical choice; how often you test, what you prioritise, and how you document results is a strategic decision. Teams that only think about the former end up with a pile of one-off wins and no repeatable process.
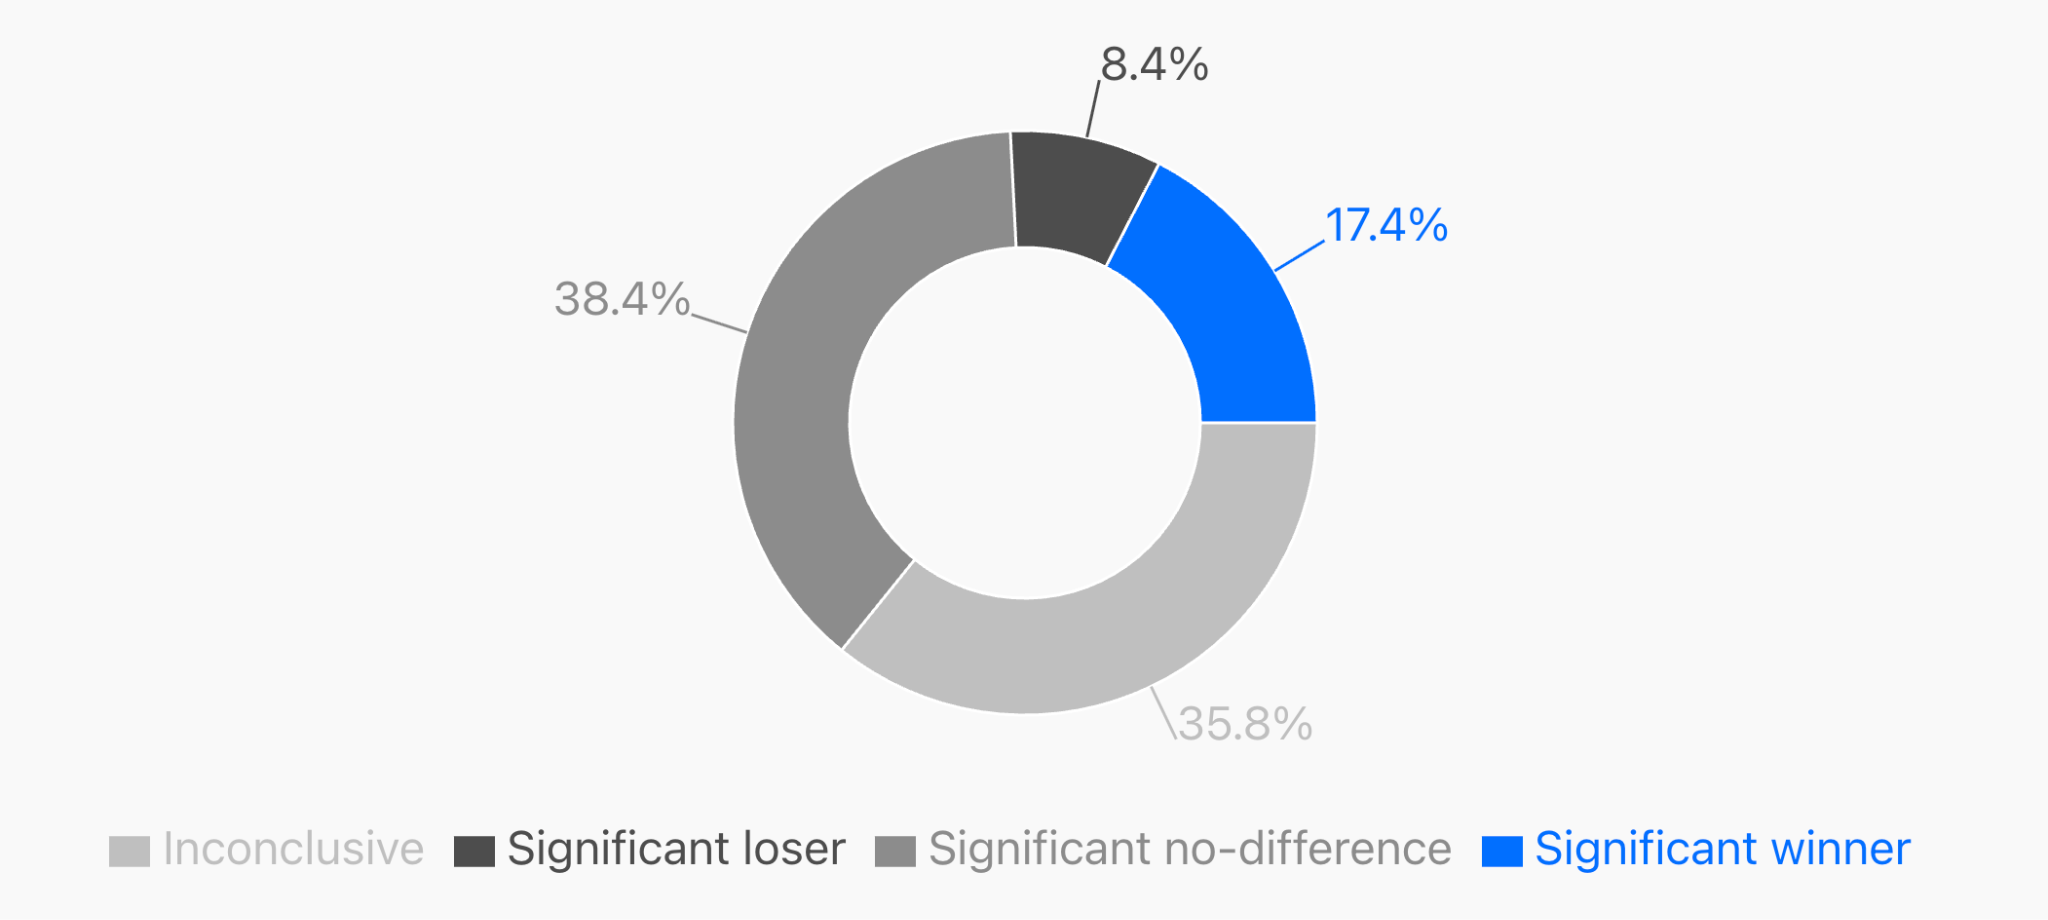
- Document losing tests, not just wins. A test that disproves a hypothesis is still useful data. Without a record, teams re-test the same idea a year later, having forgotten it was already tried. Losing is the norm, not the exception: Visionary Marketing's analysis of 2,408 A/B tests run between January 2023 and March 2026 found that only 17.4% reached statistical significance with a winning variant.
Conclusion
A/B testing should always look the same: you form a hypothesis, isolate one variable, run the test to a real sample size, and let the result—not the loudest opinion in the room—decide what ships.
To run an effective A/B testing strategy, your engineering team needs to know how to actually implement two versions of something without doubling your codebase, and how you keep a bad variant from doing damage before you catch it.
Feature flags can solve both problems, giving you a single control point to assign traffic, roll out gradually, pull back instantly if a guardrail metric moves the wrong way, and skip the redeploy each time you adjust exposure.
Sign up for Flagsmith and set up your first multivariate flag in minutes.
A/B testing FAQs
How long should an A/B test run?
Run a test for at least one full business cycle, typically a week, so it captures both weekday and weekend behaviour. Longer sales cycles or lower-traffic pages may need several weeks to reach a reliable sample size—use your calculated sample size, not a fixed calendar deadline, to decide when to stop.
What sample size do I need for an A/B test?
It depends mainly on your current conversion rate and the minimum effect size you want to detect, plus the confidence level you're aiming for. Feed those numbers into a sample size calculator, and it will give you the number of users per variant you need before checking results.
Can I run more than one A/B test at the same time?
You can, but overlapping tests on the same audience can interact and distort both results. If you need to run multiple tests concurrently, either test unrelated parts of the product and user journey, or use mutually exclusive traffic splits so no single user lands in more than one test at once.

































OpenTelemetry, without the vendor lock-in: Introducing full observability for Open Source and Self-Hosted Flagsmith customers