Bayesian A/B Testing: What It Is and How It Works

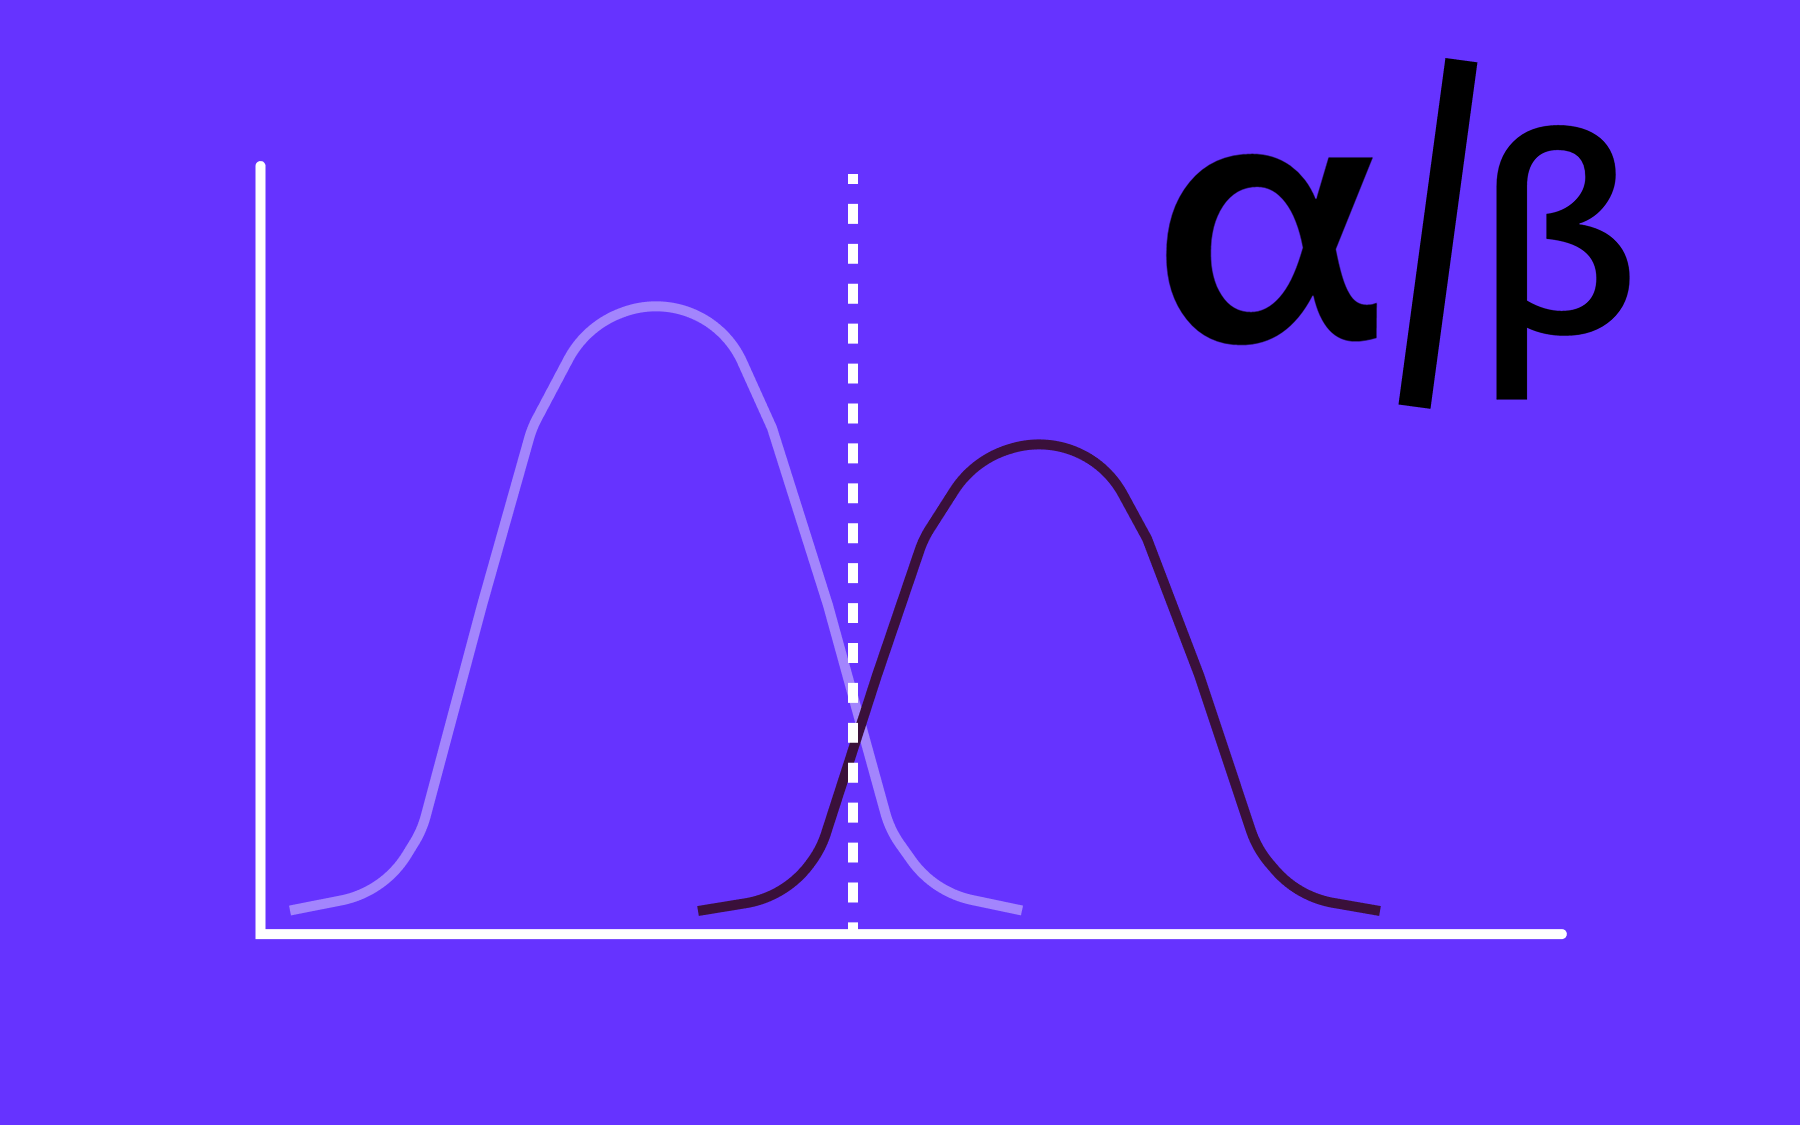
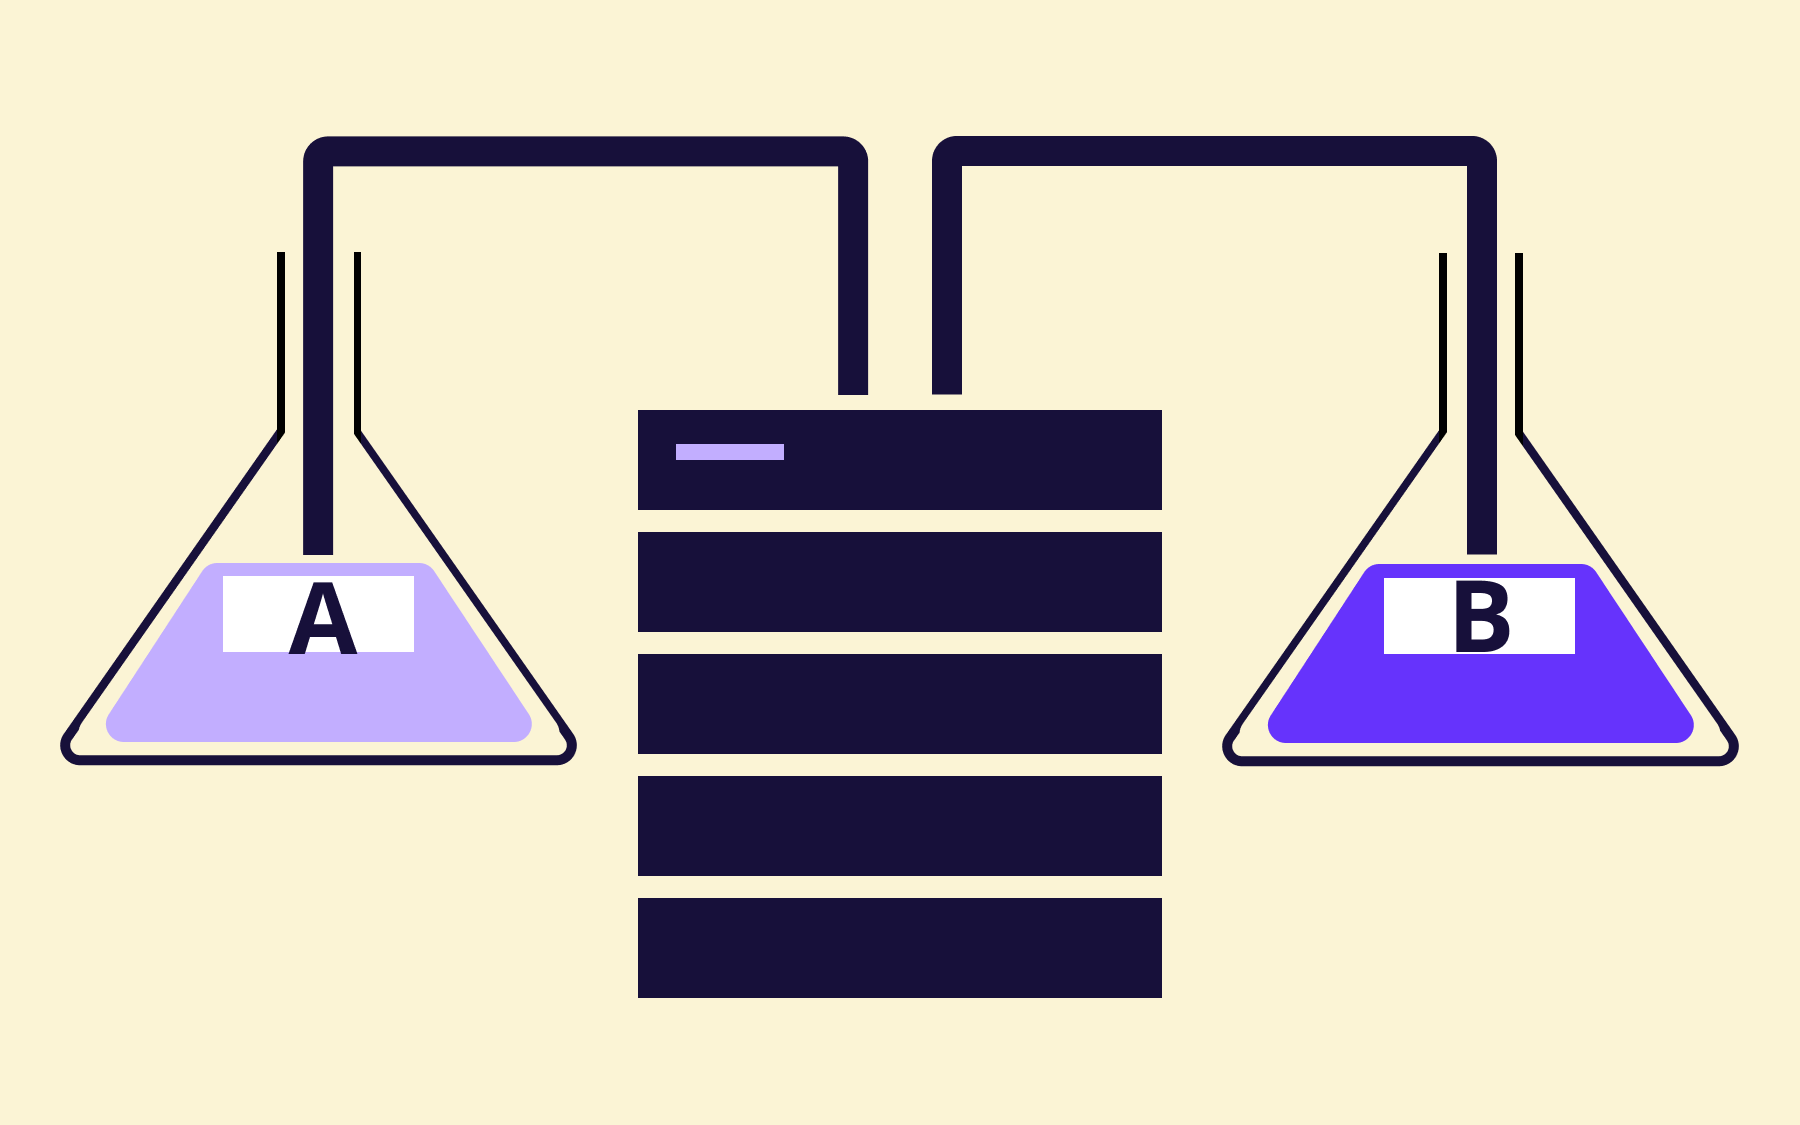
Instead of checking whether a result clears a fixed significance threshold, as you would in a standard A/B test, with Bayesian A/B testing, you get a direct answer to how likely it is that variant B beats variant A, updated as more data comes in.
This guide covers what Bayesian A/B testing is, how it works, and how it compares to the frequentist approach most testing tools still default to.
You'll also find a worked example and the key terms you'll run into along the way, plus a look at where Bayesian methods fit naturally into a feature-flag-driven release process.
What is Bayesian A/B testing?
Bayesian A/B testing is an approach to A/B testing where you already have an assumption about the likely outcome for two versions of the test—whether it's on a web page, a UI, a feature, or an onboarding flow—and update that belief as observed data arrives.
The result is a posterior distribution: a full probability distribution over the true conversion rate, rather than a single number.
With a frequentist test, you check whether you can reject a null hypothesis at a fixed significance level, and the result comes back as a p-value. With a Bayesian A/B test, you ask a more direct question instead: how likely is it that this variant is actually better?
The result comes back as a probability, alongside a range of possible values for how much better it might be.
Both approaches address the same underlying question, with each just expressing uncertainty in different ways. That difference has an impact on how you read results, how much data you need, and when it's safe to check in on a test before it finishes.
How Bayesian A/B testing works
At the core of Bayesian A/B testing is Bayes' theorem: a way of combining what you already believe with what the data shows you, to arrive at an updated belief.
Your prior distribution is your belief about the true conversion rate before you've seen any data from this particular test. With no historical data or domain expertise to draw on, use a weak or non-informative prior, often a uniform distribution, that treats every possible conversion rate as equally likely to start.
Where you do have prior knowledge, from previous experiments or historical data on a similar page, you can build that in from the outset with an informative prior.
As the test runs, each observed conversion becomes part of the data's likelihood distribution: how probable the observed data is, for every possible value of the true conversion rate. Multiply the prior by the likelihood, and you get the posterior distribution: an updated belief about the true conversion rate, given both what you expected going in and what actually happened.
For conversion-rate data, a beta prior paired with a binomial distribution of successes and failures is the standard choice. A beta distribution is the conjugate prior for binomial data, so the maths works out to another beta distribution rather than something with no closed-form solution.
Without a conjugate prior distribution available—e.g., more complex models, multiple metrics, or non-binary outcomes—you can instead turn to simulation methods like Markov Chain Monte Carlo to estimate the posterior numerically.
Say you want to know how accurate a darts player is; how often they hit treble 20. Before you've seen them throw, your guess is wide open: a pub player might land it 1 in 10, a county-level player 5 or 6 in 10. Then the evidence arrives. Their first dart thuds into the treble, which is promising, but one dart could be luck, so your range barely moves.
After a few legs, you can say "probably between 30% and 45%." After a whole evening, you might be confident it's 36–40%. Each dart doesn't replace your estimate; it narrows it.
Run a Bayesian A/B test on conversion rate, and you see the same pattern: broad and uncertain at the start, narrower and more confident as more data arrives.
Bayesian vs. frequentist A/B testing
The frequentist approach is the one most people use when they run A/B testing without qualification, and it's still the default in plenty of A/B testing tools.
With a frequentist approach, you treat the true conversion rate as a fixed, unknown number, set up a null hypothesis (no difference between variants) against an alternative hypothesis (variant B performs differently), and calculate a p-value—the probability of seeing a result this extreme if the null hypothesis were actually true.
If that p-value falls below a threshold, usually 0.05, you reject the null hypothesis and call the result statistically significant.
Bayesian methods don't use that reject-or-fail-to-reject framing. Instead, you treat the true conversion rate itself as uncertain, and describe that uncertainty directly as a probability distribution. The output is a probability that variant B beats variant A, plus a credible interval for the likely size of the uplift.
Frequentist methods are simpler to compute and don't require choosing a prior. They're also still the shared language most stakeholders already understand. Choosing Bayesian methods trades some of that simplicity for an answer that maps more directly onto the business decisions you're actually trying to make, and for the ability to check in on a test as it runs without undermining the result.
Repeatedly checking a frequentist test before it reaches its planned sample size inflates the real false-positive rate well above the 5% most people assume, while a Bayesian A/B test's probability estimate stays valid at any point you choose to look.
Key Bayesian A/B testing concepts explained
You will encounter a handful of terms that are relevant to Bayesian statistics. Here's what each one means in the context of an A/B test with two variants (the same idea extends to multivariate testing once you're comparing more than one variable at a time).
- Prior distribution: Your belief about the true conversion rate before the test starts, expressed as a probability distribution rather than a single guess. A non-informative prior assumes little; an informative prior draws on prior knowledge from earlier tests.
- Likelihood distribution: How probable the data you've actually observed is, calculated across every possible value of the true conversion rate. This is the test data's contribution to the calculation.
- Posterior distribution: The updated belief that comes from combining the prior distribution with the likelihood distribution: your answer, after accounting for both what you expected and what happened.
- Credible interval: The range that you're a given percentage confident the true value falls within, based on the posterior distribution. Unlike a confidence interval, a credible interval can be interpreted directly as a probability statement about the parameter itself, which is closer to how most people instinctively read it anyway.
- Probability to be best: The posterior probability that a given variant has the highest true conversion rate of those being tested, expressed as a straightforward percentage.
- Expected loss: The average cost of picking a variant that turns out not to be the true winner, weighted by how likely that outcome is and how large the loss would be. It's a useful way to decide whether a result is safe to act on even when the probability to be best isn't overwhelming.
- Beta distribution: The standard choice of probability distribution for modelling a conversion rate: its shape is flexible enough to represent everything from a wide, uncertain guess to a narrow, confident one.
A narrow credible interval, built on more data, means real confidence in the result. A wide one, typically from less data or a weaker prior, means there's still meaningful uncertainty in the possible values for the true conversion rate.
A worked Bayesian A/B testing example
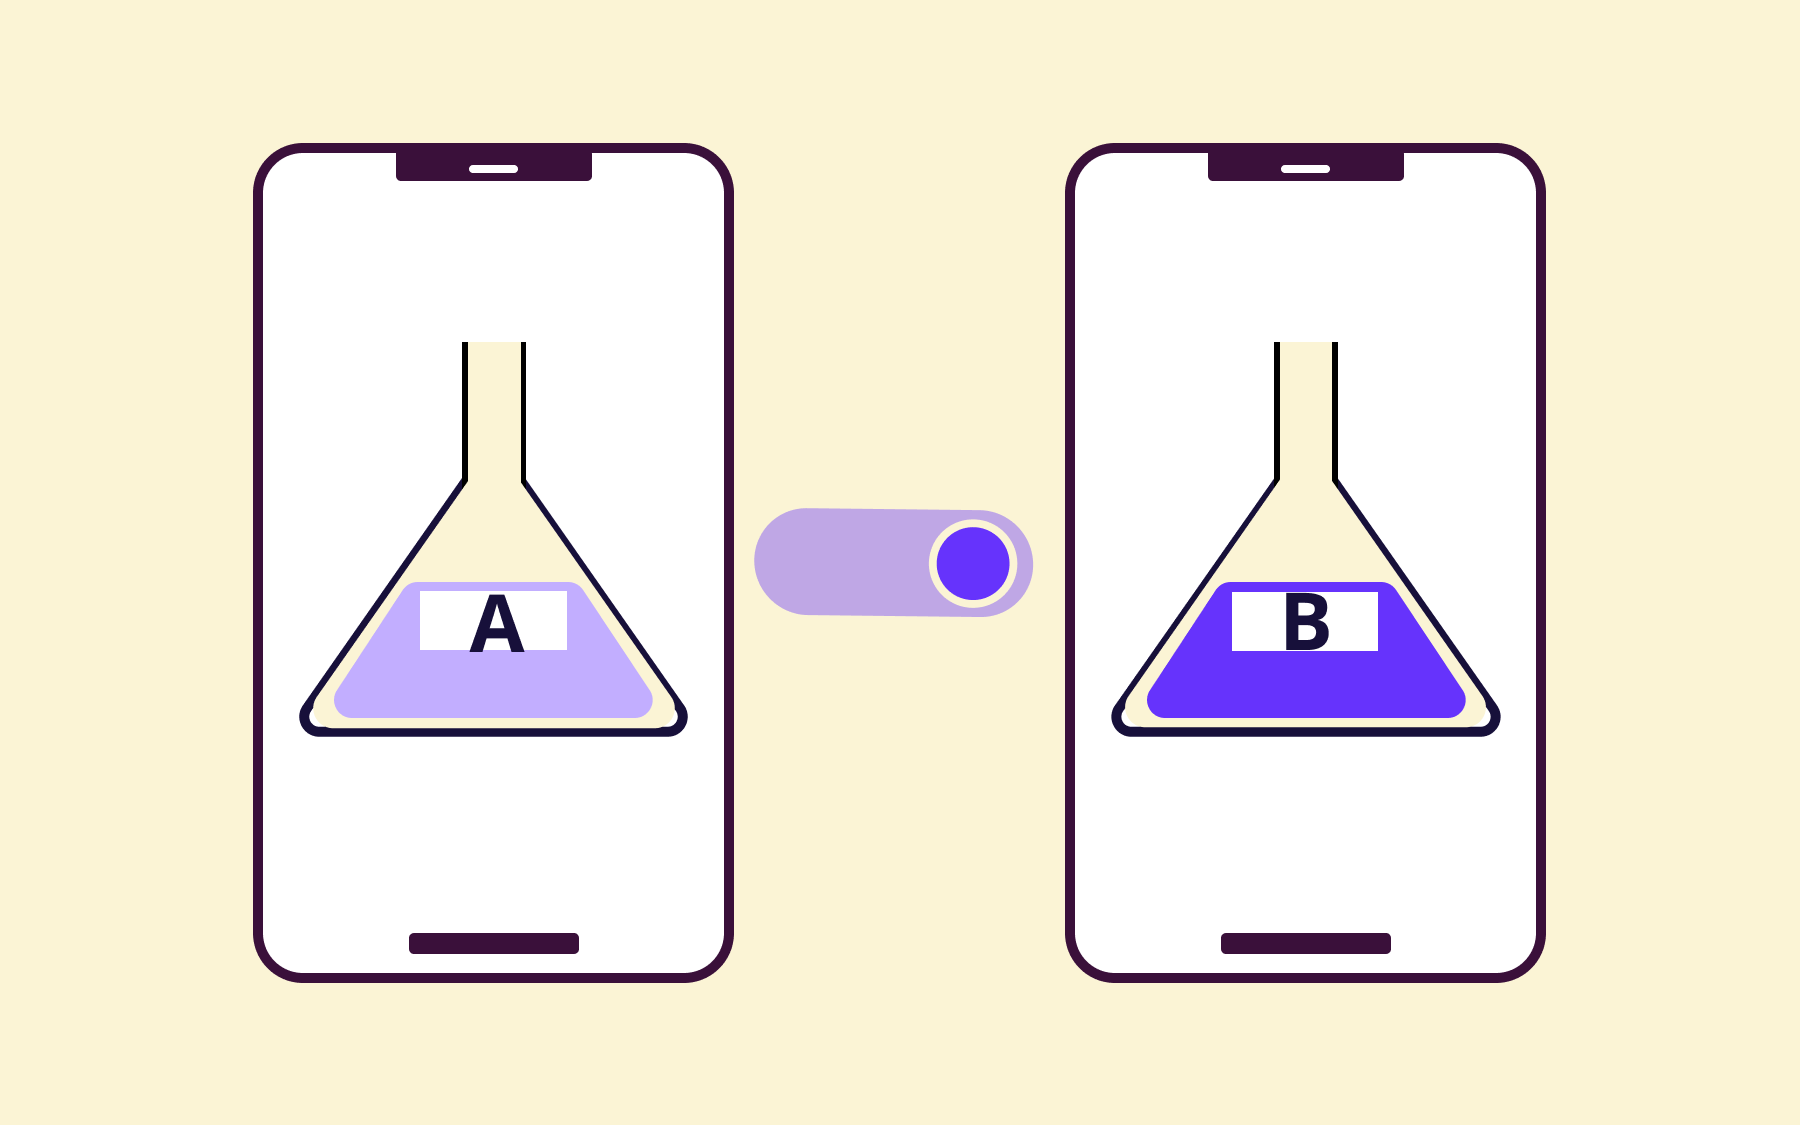
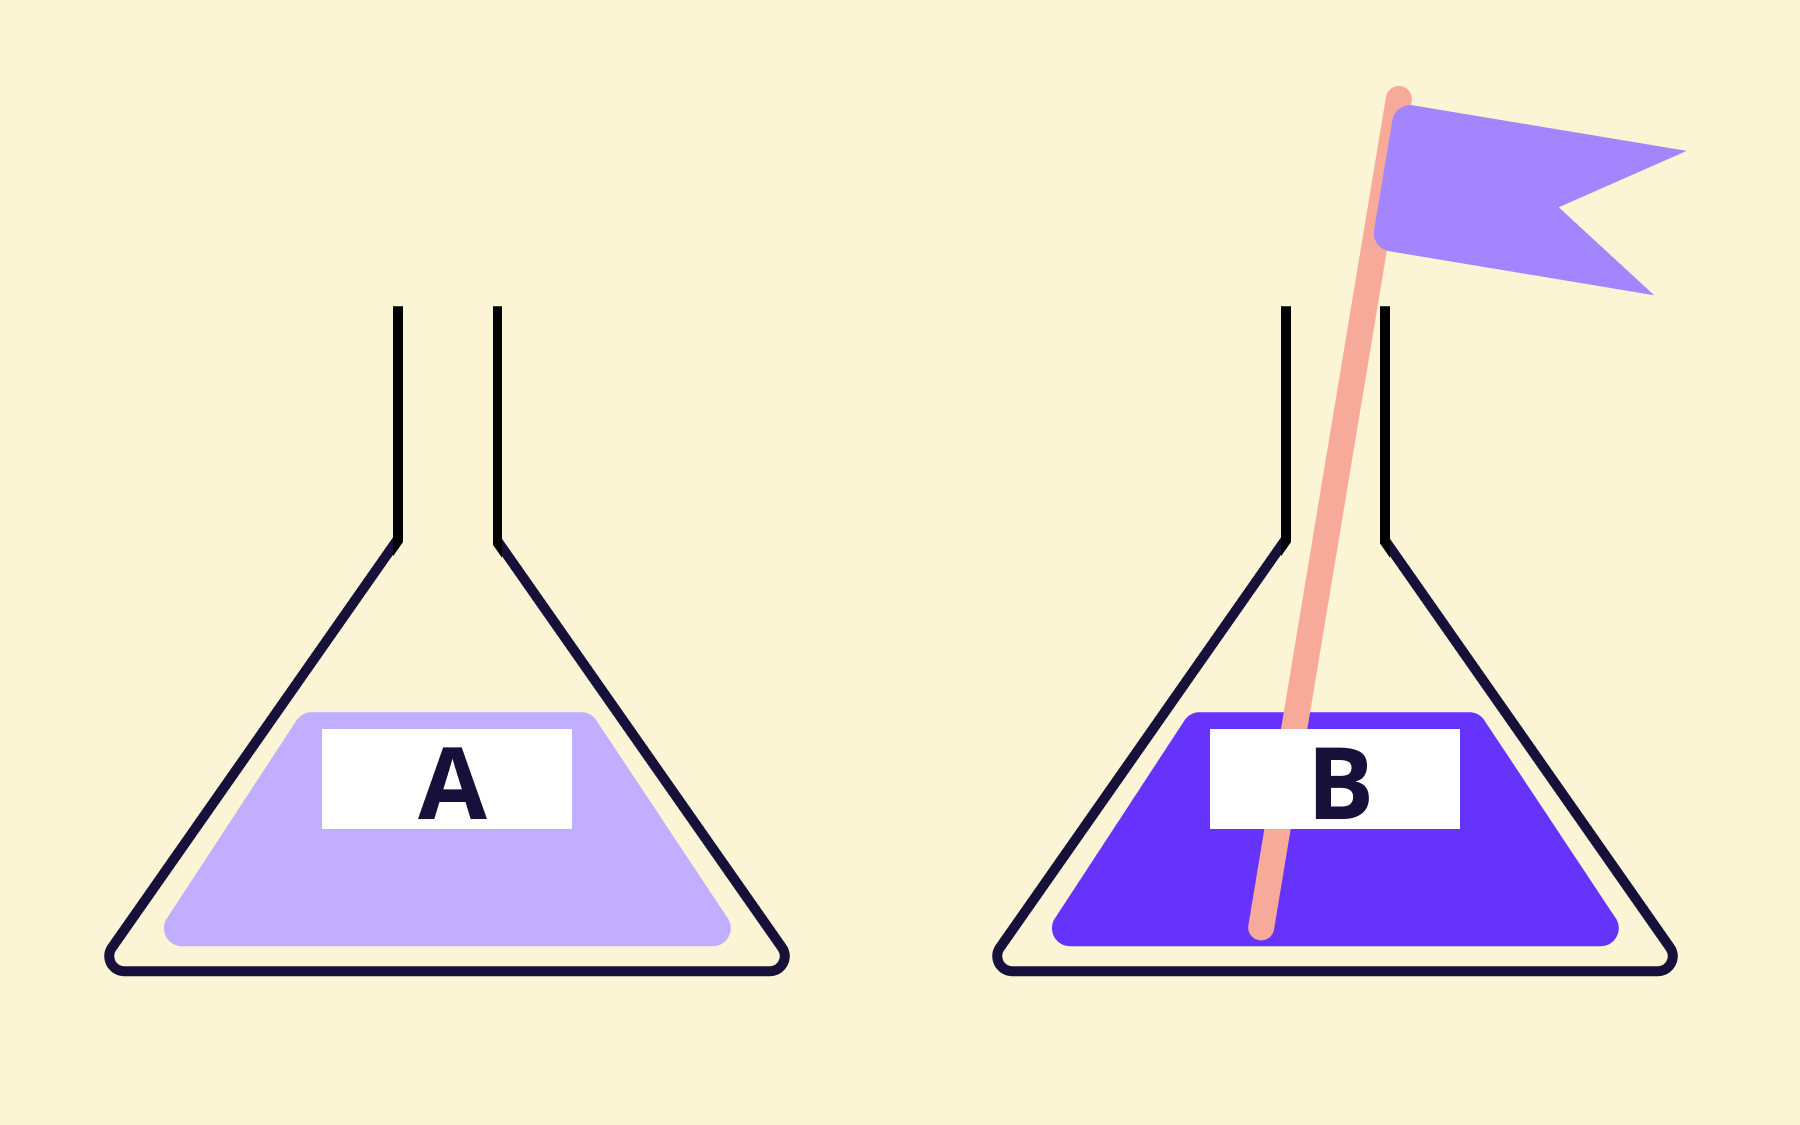
Say you're testing two versions of an onboarding flow. Version A is the existing control group; version B is a new variant you think will convert better.
With no historical data on this specific flow, you start from a non-informative, roughly uniform prior for both variants: every conversion rate between 0% and 100% is equally plausible before the test begins. As the observed conversions come in, you update that prior into a posterior distribution for each variant's true conversion rate.
Running the numbers gives a probability of around 90% that version B's true conversion rate is higher than version A's, with an estimated true uplift of roughly 18%, and a 95% credible interval spanning from around -2% to +40%.
Note that the interval crossed zero: the direction is likely correct, but the exact size of the win is still uncertain, and pinning it down more precisely needs more data.
What you do with that result depends on your risk tolerance and how much traffic you have left to run. A 90% probability that B wins, paired with a low expected loss from choosing it, is often enough to ship the change and keep monitoring. A team that wants tighter certainty before committing can keep the test running until the credible interval narrows further.
The benefits of a Bayesian approach to A/B testing
Here's why more testing tools have added Bayesian statistics engines alongside, or instead of, a frequentist approach.
- Results are easier to act on: A 92% probability that B is better is far easier for stakeholders to act on than a p-value and a null hypothesis rejection: it's closer to how people naturally think about a decision already.
- You can check results safely, as they happen: Because Bayesian methods don't depend on reaching a pre-committed sample size, you can look at results partway through without inflating the false-positive rate the way repeated peeking at a frequentist test does.
- It builds on what you already know: In those cases where you have domain expertise or historical data from previous experiments, you can build it into an informative prior from the start, rather than starting from scratch as though nothing was learned before.
- It can work with less data: Starting from a weak or informative prior means usable signal often emerges sooner than waiting for a frequentist test to reach full statistical significance—particularly useful for lower-traffic pages or smaller segments.
The limitations of Bayesian A/B testing
An informative prior that's chosen poorly can quietly bias a result toward what you expected to see, rather than what the data actually shows—especially with a smaller sample size, where the prior carries proportionally more weight. If you are overconfident and get it wrong, a test can look more certain than it actually is.
There's also a computational cost. A frequentist calculation is often a closed-form formula; estimating a Bayesian posterior without a conjugate prior distribution available takes simulation methods like Markov Chain Monte Carlo instead, which means more processing time and more careful implementation to get right.
You may also find that your team is unfamiliar with Bayesian A/B testing. P-values and confidence intervals are what most people understand, and what most existing dashboards report.
A stakeholder unfamiliar with Bayesian analysis needs a bit more explanation of what a 90% probability to win does and doesn't mean, compared with a statistic they've already half-learned to distrust.
Bayesian A/B testing and feature flags
One advantage of Bayesian A/B testing pairs naturally with feature-flag-driven releases, as you can check results safely at any point, without inflating your error rate.
With a fixed-sample-size frequentist test, you wait until a predetermined amount of data has been collected before drawing a conclusion, which is rarely how a real release actually goes.
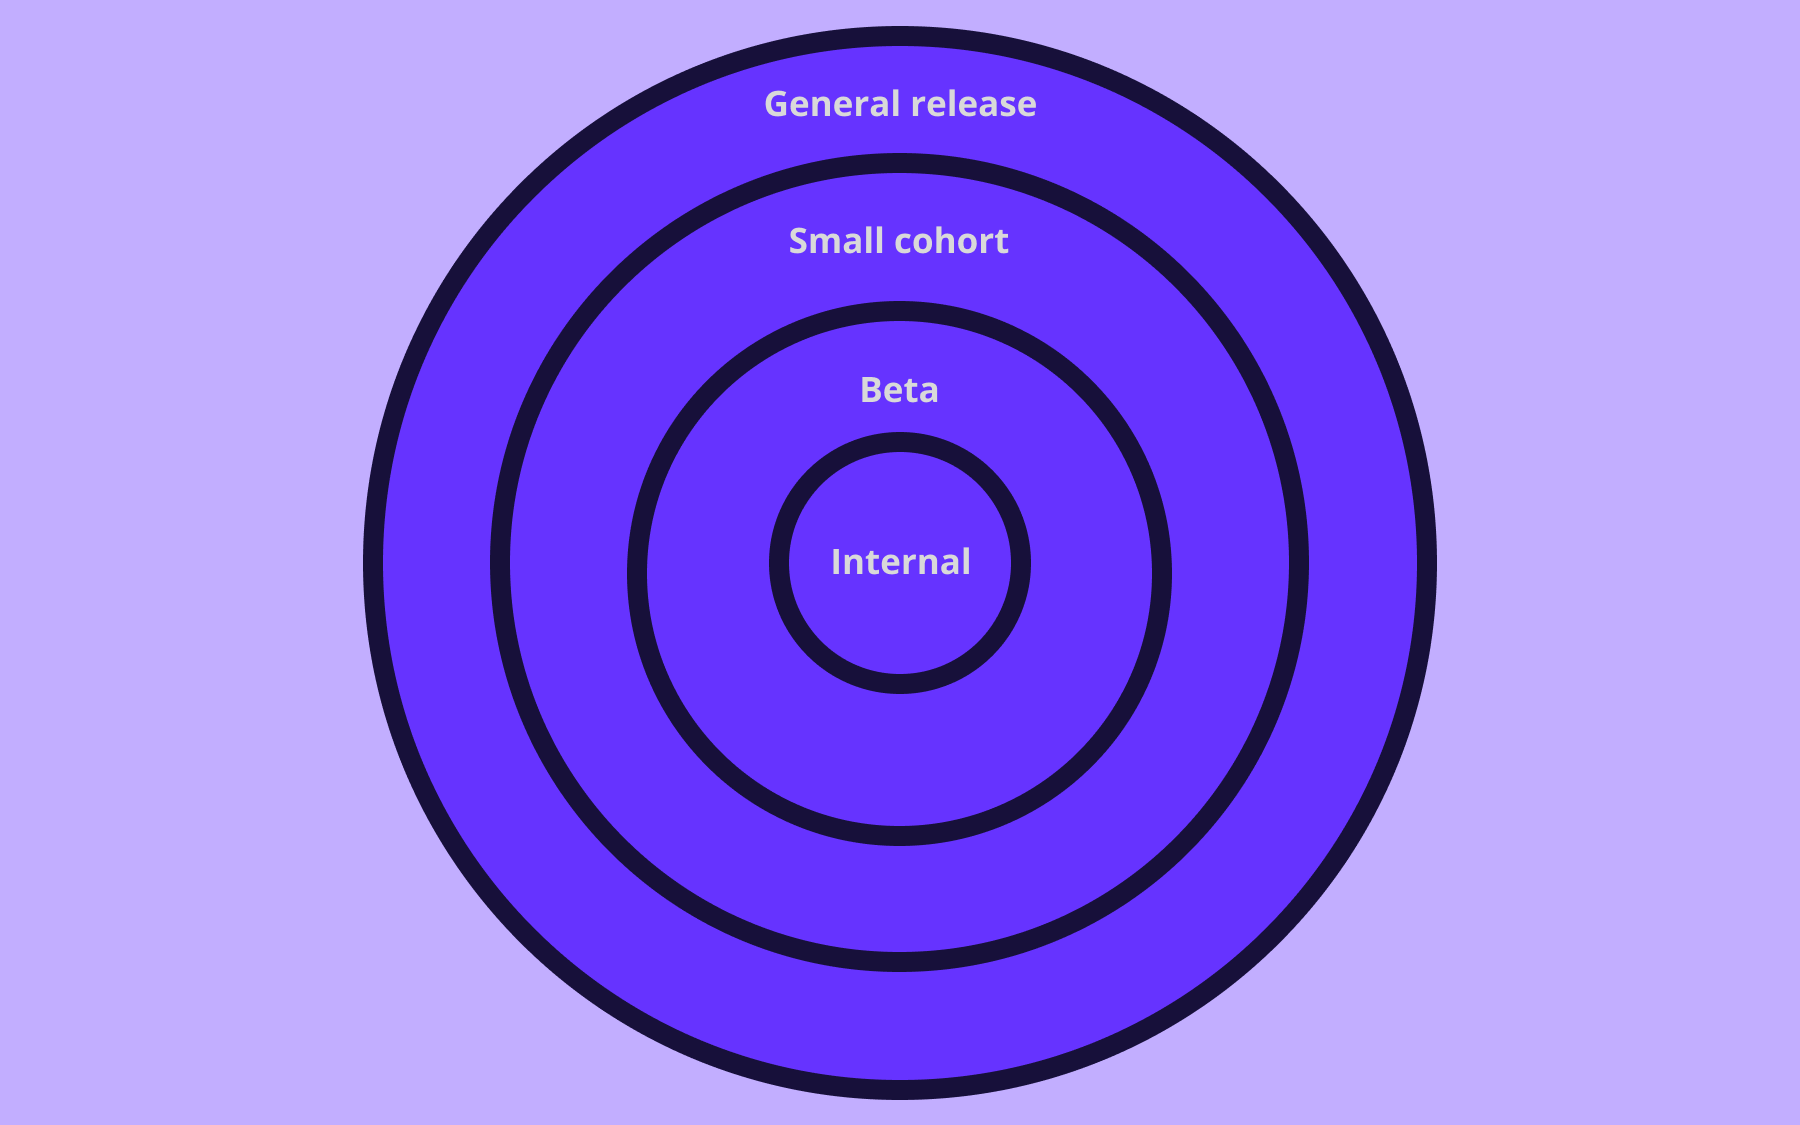
Traffic ramps unevenly and priorities shift mid-test, so teams often want to adjust a rollout well before a formal endpoint is reached.
Because a Bayesian A/B test's probability estimate is valid at any point you choose to look, a team can watch the posterior probability update in near real time and use it to decide when to ramp a winning flag up to more users, or roll a losing one back, rather than waiting on an arbitrary stopping point.
Running that kind of continuous, flag-driven test well depends on the same discipline any product experimentation framework requires: a clear hypothesis and feature flags you can use to ramp or roll back a variant safely, whatever statistical approach sits underneath the results.
Bayesian A/B testing with Flagsmith Experimentation
Flagsmith's own Experimentation feature is currently in beta, which runs on a Bayesian statistics engine that will report results as lift against a control group, with credible intervals and a chance to beat control for each variant.
That decision comes down to the same two practical advantages covered above. A result like "97% chance to beat control" is harder to misread than a p-value, and it doesn't depend on reaching a fixed sample size first, so it's safe to check at any point during a test without inflating the risk of a false positive—unlike checking in on a frequentist test before it's finished.
If you are interested in trying our Experimentation feature in beta, get in touch.
Conclusion
Bayesian A/B testing answers the question, "How likely is it that this variant wins?" more clearly than a p-value does. Start with a clear prior, however weak, and let the posterior distribution do the updating as your data comes in.
If you're running feature-flag-driven experiments and want the statistics engine behind them built on the same Bayesian approach, sign up for a free Flagsmith account and see how Experimentation fits into your release process.
Bayesian A/B testing FAQs
How does Bayesian A/B testing work?
You combine a prior distribution—your belief about the true conversion rate before the test—with the likelihood of the data you observe, using Bayes' theorem, to produce a posterior distribution.
That posterior updates continuously as more data arrives, and can be summarised as a probability that one variant beats another, plus a credible interval for the likely size of the difference.
When should you use Bayesian A/B testing over frequentist testing?
Bayesian A/B testing is worth choosing when:
- You want to check results before a test formally ends without inflating your false-positive rate
- You have useful prior knowledge from earlier experiments worth incorporating
- Stakeholders need a plain probability rather than a p-value to make a decision
However, a frequentist approach can be the simpler, more familiar choice for a team with less statistical background or an existing dashboard built around it.
How much data does a Bayesian A/B test need?
There's no fixed sample size requirement, which is one of the method's practical advantages. You get a valid probability estimate from the moment data starts arriving, and the credible interval simply narrows as more data comes in.
How much data you need in practice depends on your starting prior and how narrow an interval you're comfortable acting on, rather than a pre-calculated sample size target.


































OpenTelemetry, without the vendor lock-in: Introducing full observability for Open Source and Self-Hosted Flagsmith customers











































.png)