
Integrating Datadog Workflows with Flagsmith for Automated Reliability


Manually rolling back features can cause widespread production issues and lead to application downtime. End users may become dissatisfied, while developers face negative customer impact.
But what happens when a feature that seemed good enough during testing suddenly becomes problematic in production? This is where feature flagging comes in. By gating features with Flagsmith and integrating workflow automation tools such as Datadog, teams can avoid scrambling to manually fix broken features.
In this tutorial, you will explore the concepts of feature flagging and workflow automation. You will also learn how to build a self-healing environment for your applications by configuring Datadog Workflows to automatically disable or adjust problematic features when errors are detected.
Prerequisites
To follow along with this tutorial, you need:
- A Flagsmith account.
- A Datadog account.
- Node.js version 18 or higher.
What are Datadog Workflows?
Imagine managing a service that millions of people depend on. As it grows, manually responding and fixing issues that arise from user interactions can become daunting and exhausting. This is what Datadog workflows address.
Datadog workflows are processes that allow developers to plan and automate end-to-end tasks triggered by alert triggers, security signals, or other events within an application. With Datadog workflows, developers can now automate tasks related to monitoring, troubleshooting, and optimisation, significantly reducing the need for manual processes.
Some key features of Datadog workflows include:
- Triggers
Datadog offers a robust feature called ‘Triggers’, which activates workflows based on specified conditions, such as a monitor entering an alert state or a detected security signal. Workflows can be triggered manually or automatically, either from a Datadog monitor or directly via its dashboard.
- Actions
Actions are the building block of Datadog workflows. They can be triggered from within the Datadog dashboard, allowing the platform to connect with other tools and services. A key action within Datadog is the HTTP action. This enables workflows to make HTTP requests and interact with third-party RESTful APIs.
- Conditional logic
Datadog's conditional logic adds an extra layer of intelligence to workflow automation, enabling developers to define multiple actions based on specific conditions such as alert severity or response codes.
Understanding Flagsmith and its API
Flagsmith is an open-source feature flag platform that supports enabling and disabling features at runtime without requiring application redeployment or downtime. In addition to its core feature flagging capability, it also supports remote configurations, A/B performance testing, and robust safety deployments.
Flagsmith also offers a powerful API that gives programmatic control over gating features and remote configurations.
The Flagsmith API is generally divided into two main types:
- The public SDK API
The public SDK API is designed for both client-side and server-side applications, allowing access to feature flag states and traits without requiring a traditional, secret API key for every request.
- The private Admin API
The private admin api enforces the use of API keys (known as Environment Key or Organisation Key) to programmatically create and toggle flags.
Setting up a demo project
To better understand how feature flags and workflow automation work in a real world scenario, you will clone a sample project and set up Flagsmith and Datadog.
To clone the demo project, enter the following commands in your terminal:
git clone --branch starter https://github.com/Slimdan20/E-commerce-project.git
cd E-commmerce-project
npm install
Note: The demo project is a simple e-commerce webpage built with Next.js. It includes a commented checkout button that will serve as the test feature for implementing Flagsmith and Datadog.
The project also contains a backend route that simulates success or failure responses when the checkout button is clicked.
Setting up Flagsmith for gating features
To get started with setting up Flagsmith, log in to your Flagsmith account.
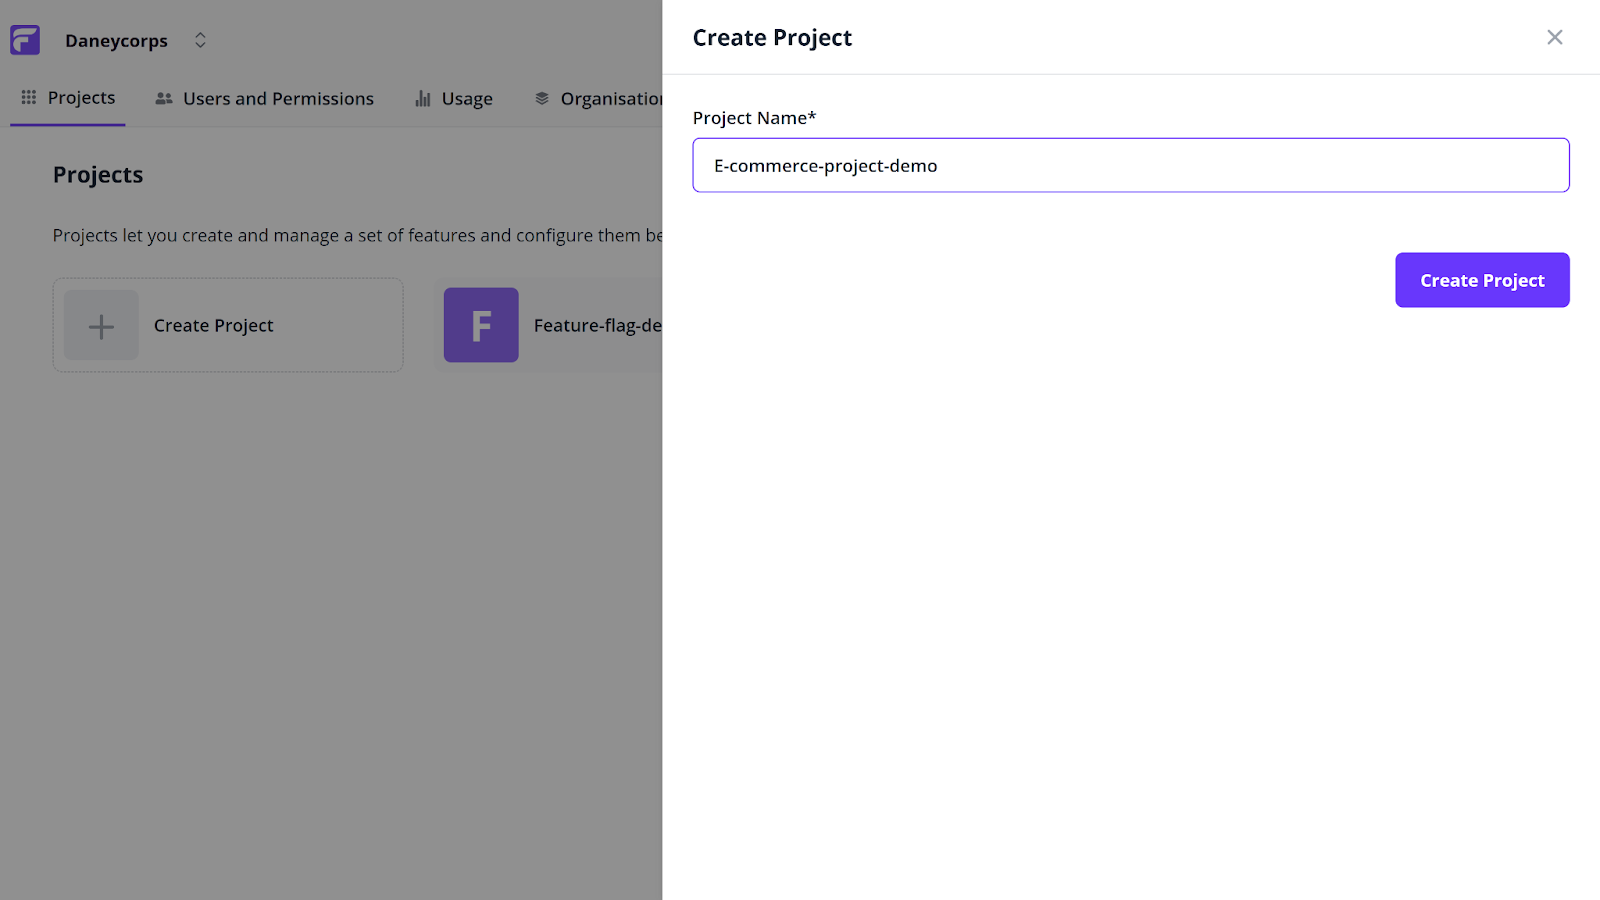
Within your Flagsmith dashboard, click the Create Project button, then enter your project name to continue.
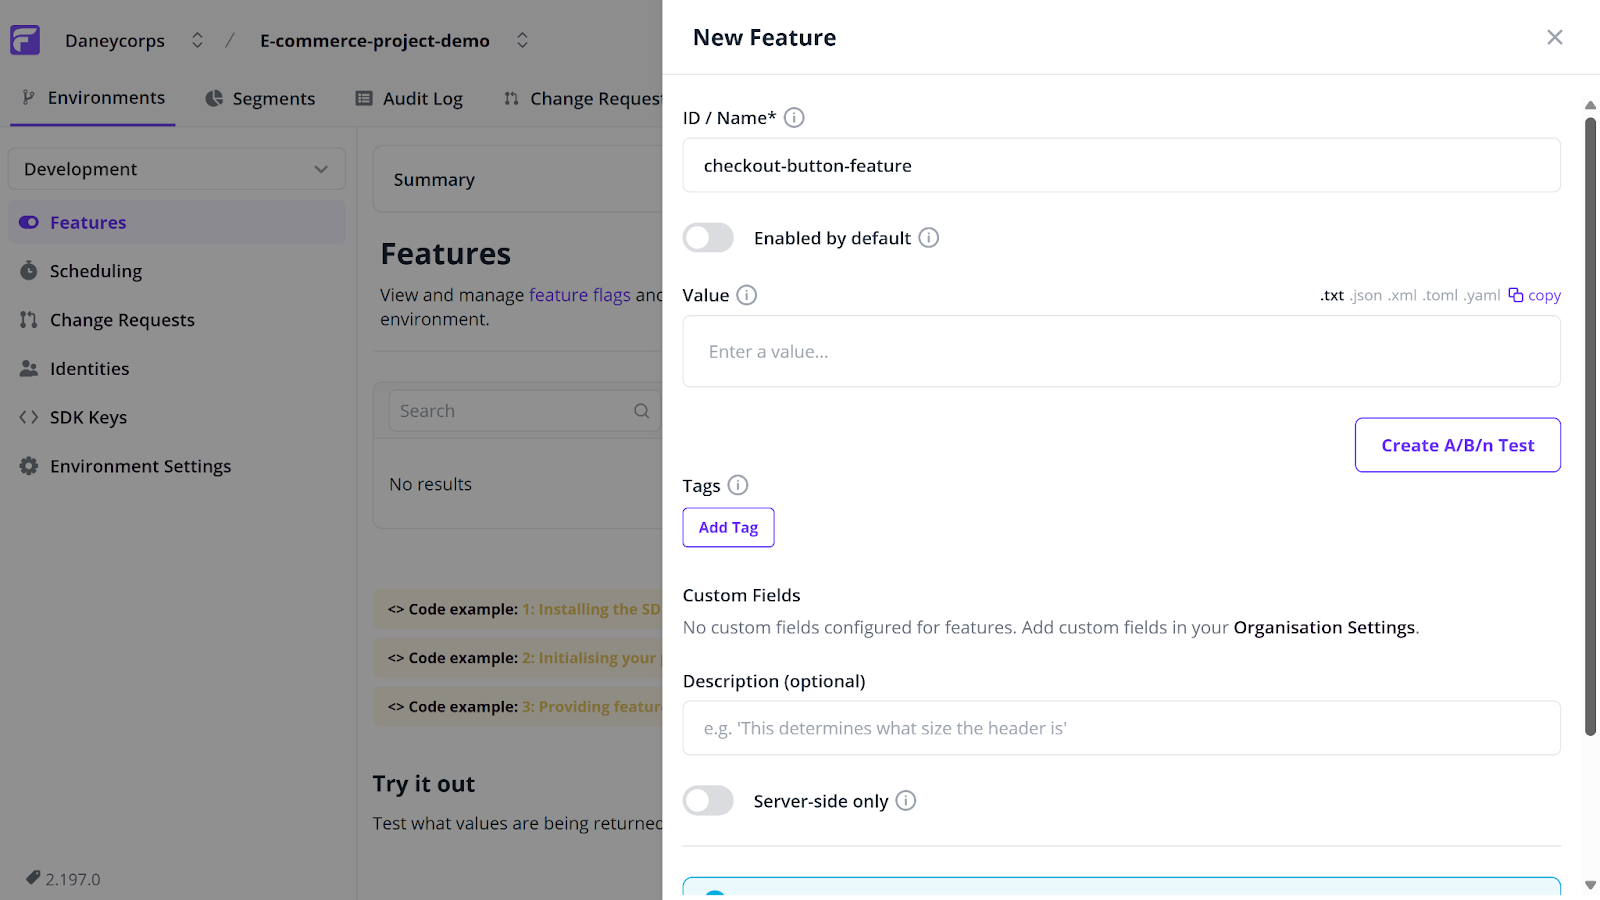
Navigate to the Features tab, click on the Create Feature button, enter a feature name, and click Create Feature to proceed.
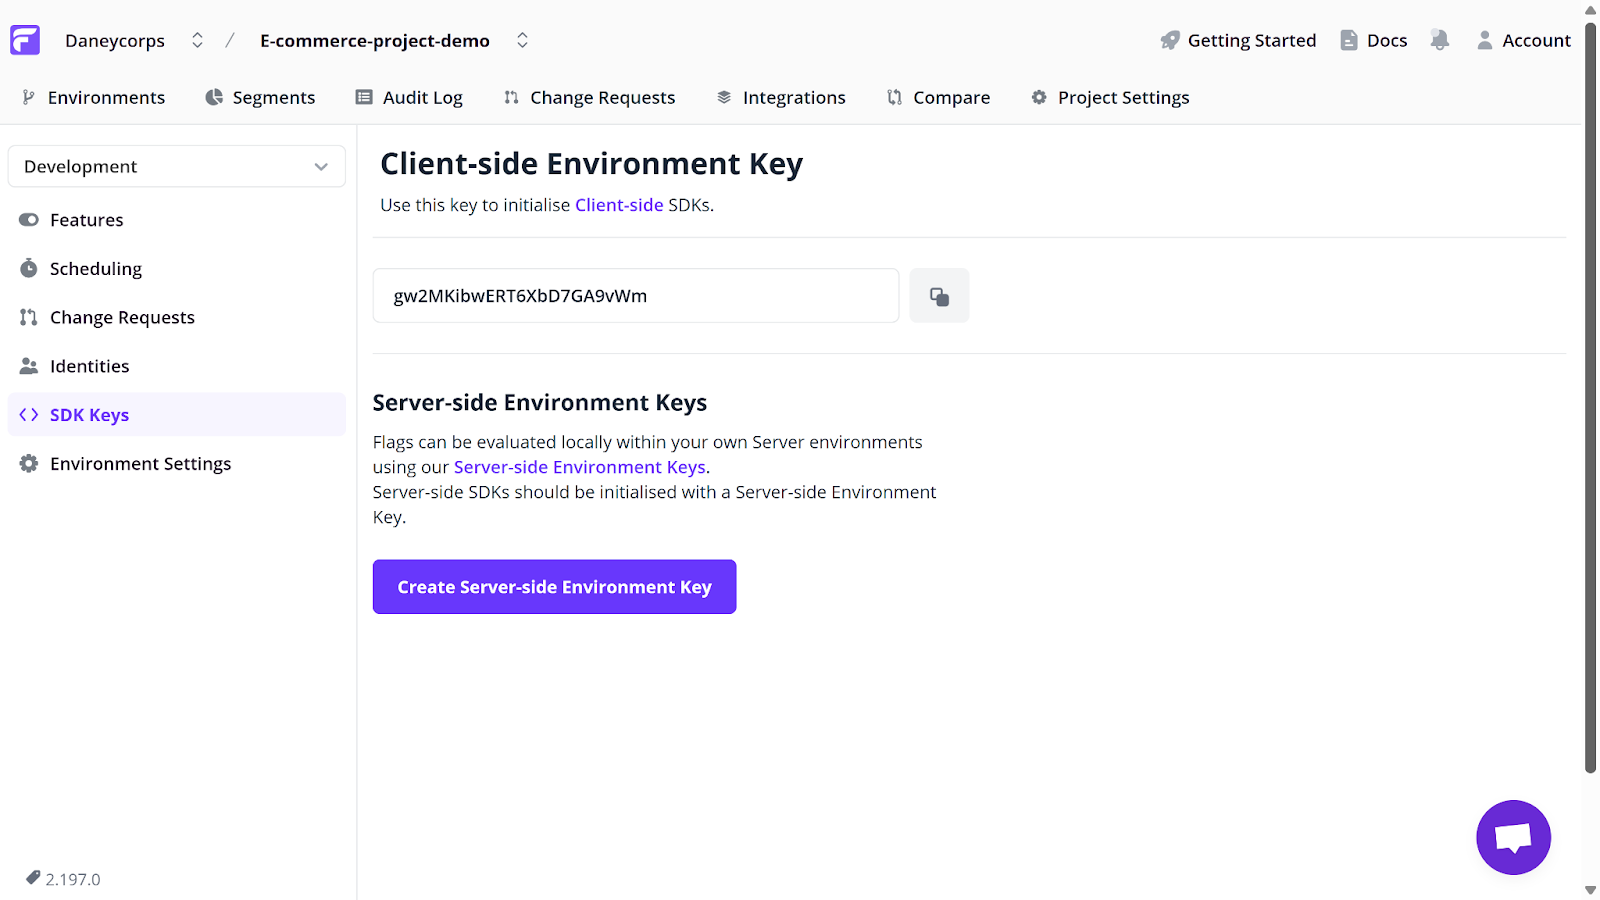
Next, head to the SDK keys tab and copy the unique Client-side Environment Key provided. You will use this later in your code.
Open your project terminal and install the JavaScript Client for Flagsmith by running:
npm i flagsmith --save
Next, go to your src/app folder and create a Providers/FlagsmithWrapper.tsx file. Your folder structure should look like this:
src/
  app/
    Providers/
      FlagsmithWrapper.tsx
Update the content of your FlagsmithWrapper.tsx file with the following:
"use client"; //Allows your react component to use hooks like useState and useEffect
import { useEffect, useState, ReactNode } from "react";
import { FlagsmithProvider } from "flagsmith/react"; //Import the FlagsmithProvider component from the Flagsmith React SDK
import flagsmith from "flagsmith"; //Import the Flagsmith client SDK instance


export default function FlagsmithWrapper({ children }: { children: ReactNode }) {
  const [ready, setReady] = useState(false);


  useEffect(() => {
    flagsmith
      .init({
        environmentID: "YOUR_ENVIRONMENT_ID", //connects your app to the correct Flagsmith project and environment
      })
      .then(() => setReady(true))
      .catch((err) => {
        console.error("Flagsmith initialization failed:", err);
        setReady(true);
      });
  }, []);


  if (!ready) return null;


  return (
    <FlagsmithProvider flagsmith={flagsmith}>
      {children}
    </FlagsmithProvider>
  );
}
Note: Replace YOUR_ENVIRONMENT_ID with your unique Client-side Environment Key copied earlier.
Next, import and wrap your demo project with Flagsmith. To do this, open your src/app/layout.tsx file and update its content as follows:
import FlagsmithWrapper from "./Providers/FlagsmithWrapper"; // import the FlagsmithWrapper component created earlier


export default function RootLayout({ children,
}: Readonly<{
  children: React.ReactNode;
}>) {
  return (
    <html lang="en">
      <body>
        <FlagsmithWrapper> {/* Wrap all child components with Flagsmith provider */}
          {children}
        </FlagsmithWrapper>
      </body>
    </html>
  );
}
Finally, open your Components/Products/Products.tsx file. This file contains your commented checkout button. Update it to use Flagsmith as shown below:
"use client"
import React, { useState } from 'react'
import Image from 'next/image'
import { useFlagsmith } from "flagsmith/react";


const Products = () => {
  const flagsmith = useFlagsmith();


  const checkoutEnabled = flagsmith.hasFeature("checkout-button-feature");


  return (
    <div id='product' className='scroll-m-32'>
      <div id='checkout' className='my-10 scroll-m-40'>
        {checkoutEnabled ? (
          <button className='cursor-pointer block m-auto text-2xl border-2 border-gray-500 bg-gray-500 w-40 h-10 text-white' onClick={handleCheckout} disabled={loading}>{loading ? "Processing..." : "Checkout"}</button>
        ) : (
          <p className="text-center text-lg font-medium">Checkout is currently unavailable!</p>
        )}
        {message && <p className="mt-4 text-center text-lg font-medium">{message}</p>}
      </div>


    </div>
  )
}
export default Products
In the code above:
- const flagsmith = useFlagsmith(); gives your component access to all feature flags data from Flagsmith.
- const checkoutEnabled = flagsmith.hasFeature("checkout-button-feature"); Checks whether the checkout-button-feature feature flag is enabled. It returns true if the feature is turned on in Flagsmith, and false otherwise.
- {checkoutEnabled ? (<button>...</button>) : (...)}; Uses conditional rendering to display the checkout button only when the feature flag is toggled on.
Now, open your project in the browser by running:
npm run devAlthough your checkout button feature is present in your code, you will notice that it is not yet visible on your e-commerce page. This is because you have not yet toggled the feature on in Flagsmith.
To make your checkout button feature visible, navigate to the Features tab in your Flagsmith dashboard, locate your created feature (in this tutorial, it is the checkout-button-feature), and toggle it on.
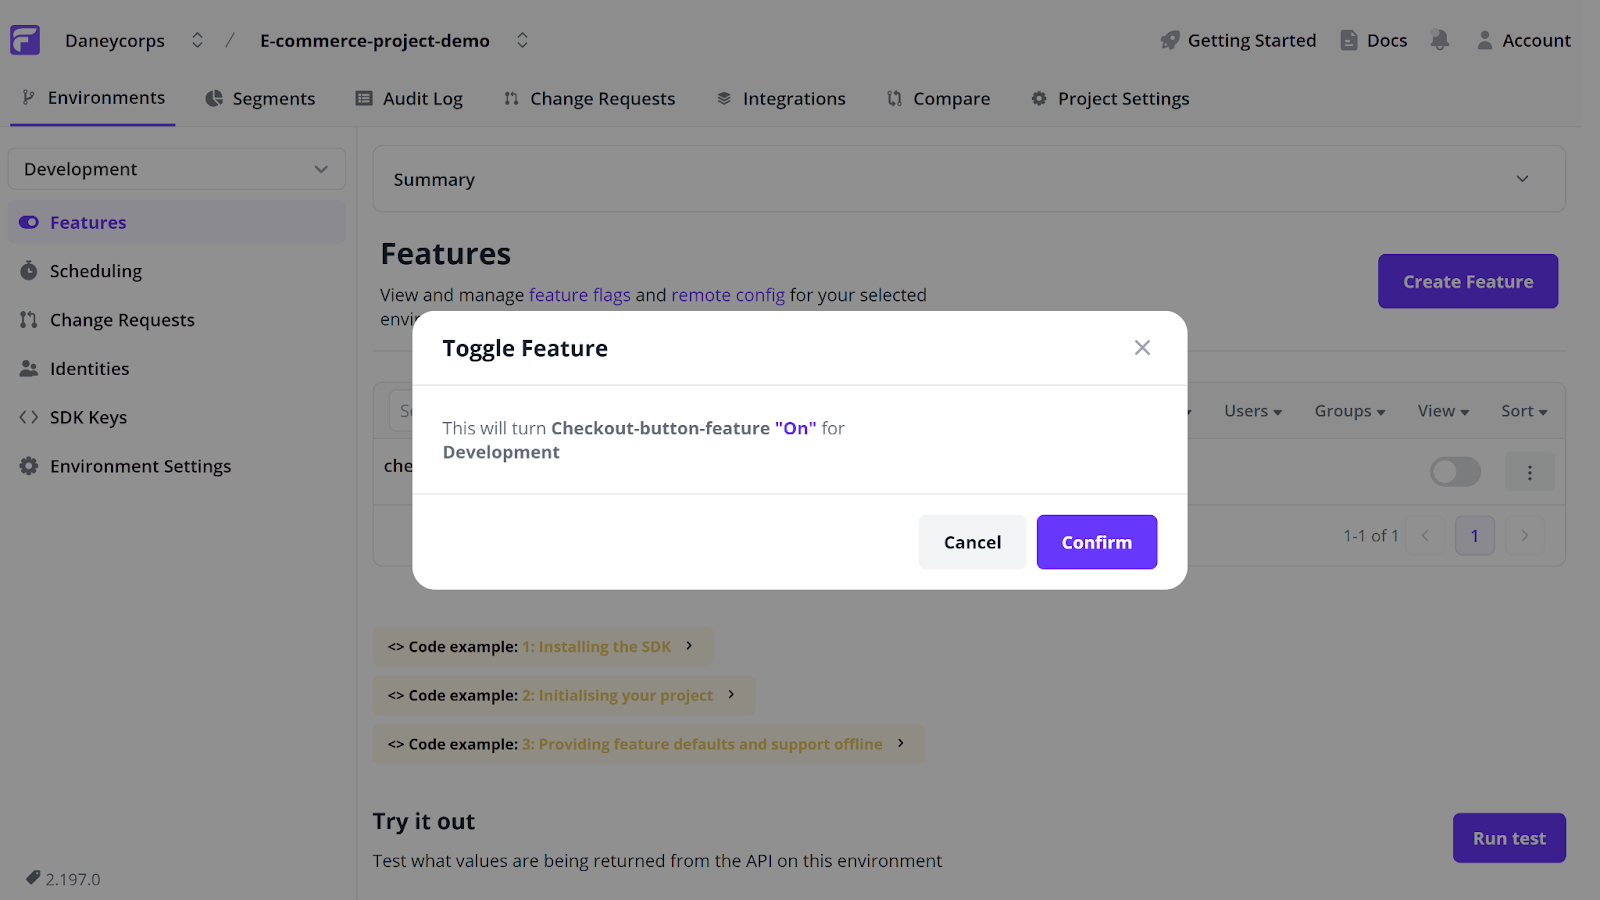
Reload your application in the browser to see your active checkout button feature.
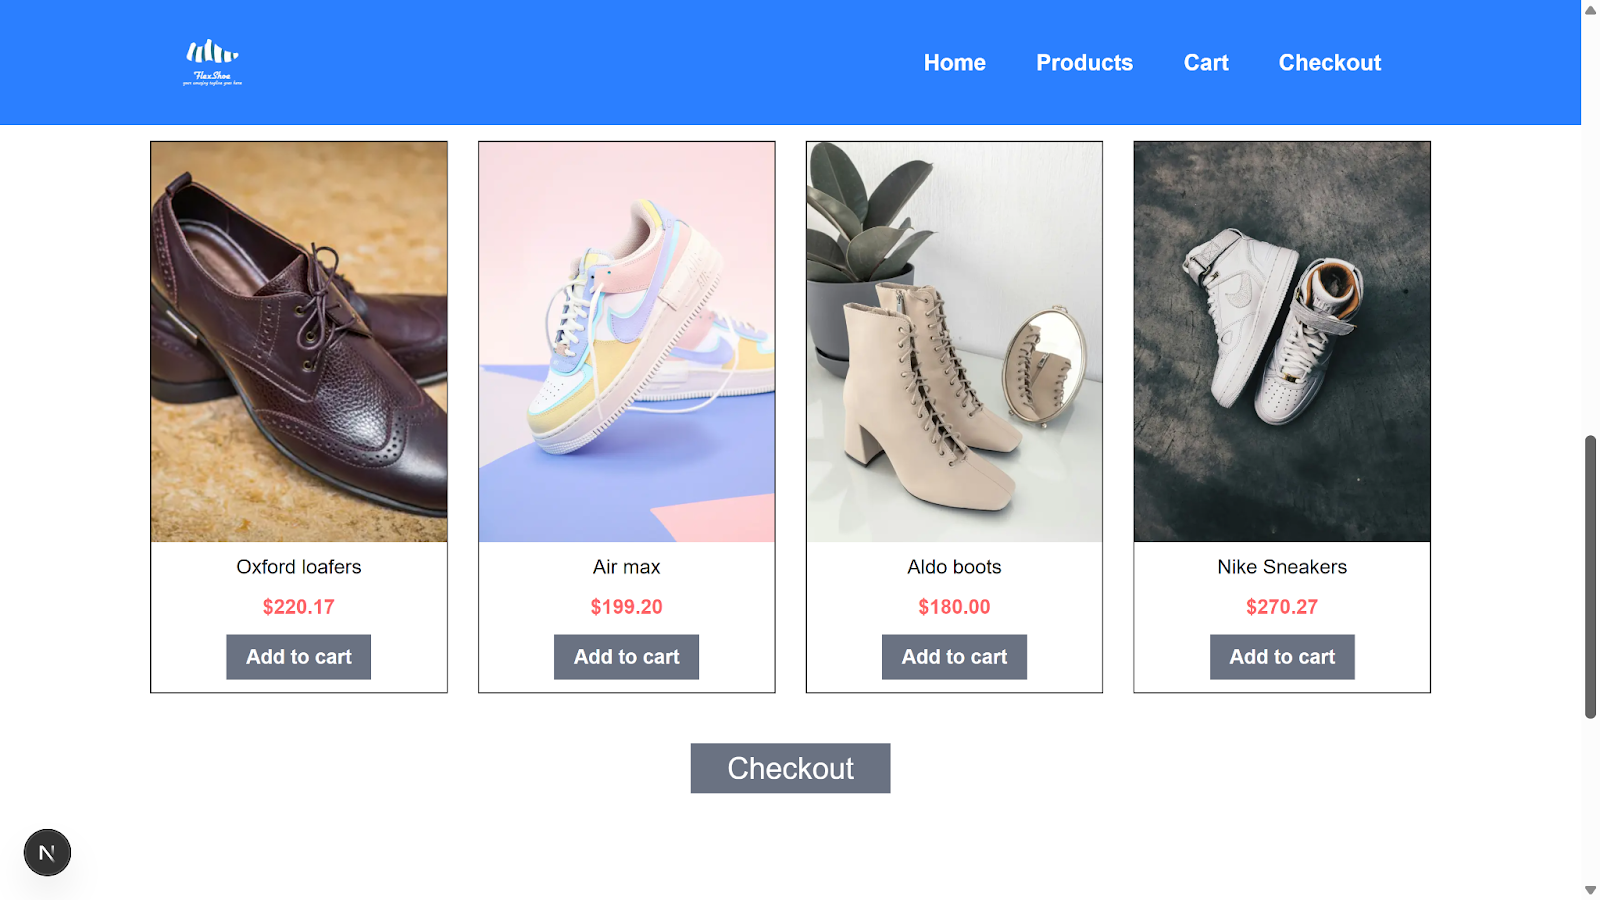
There you go! You can now decide when to make your feature available or roll back features at your convenience.
Setting up Datadog log collection
With Flagsmith fully installed and configured in your demo project, the next step is to set up an automated workflow to monitor your application’s performance using Datadog. This ensures specific actions are automatically carried out when certain error thresholds are triggered.
However, before automating your workflow, you must first ensure your project is accurately sending error logs to your Datadog account.
You can do this by heading to the Datadog dashboard → Settings → Organization Settings → API Keys.

Click on the New Key button and enter a key name (such as Project monitoring key), then proceed by clicking Create Key.

Copy the provided key and proceed to your demo project to continue.
Within your project, open your src/app/api/v1/checkout/route.ts file and modify its content to include the Datadog log intake logic as follows:
 if (simulateError === "true") {
    const response = await fetch("https://http-intake.logs.us5.datadoghq.com/api/v2/logs", {
      method: "POST",
      headers: {
        "Content-Type": "application/json",
        "DD-API-KEY": process.env.DATADOG_API_KEY!,
      },
      body: JSON.stringify([
          {
          ddsource: "nextjs",
          service: "ecommerce-demo",
          ddtags: "env:demo",
          host: "localhost",
          message: "Checkout failed due to simulated error",
          status: "error",
          }
    ]),
    });
    console.log("Datadog log response status:", response.status);
In the above code:
- await fetch(){...} Send a POST request to Datadog’s Logs API endpoint authenticating it using your Datadog API key.
- body: JSON.stringify([{...}]) defines the log entry to be sent to Datadog specifying its source and environment.
Next, at the root of your project, create a .env.local file and update its content with:
DATADOG_API_KEY = "Your-copied key"To verify that your error simulation works correctly, enter the below command in your terminal:
curl -X POST "http://localhost:3000/api/v1/checkout?simulate_error=true"Note: Repeat this a couple of times to generate enough errors for Datadog to log.
This will return a JSON message, indicating that the checkout failed.
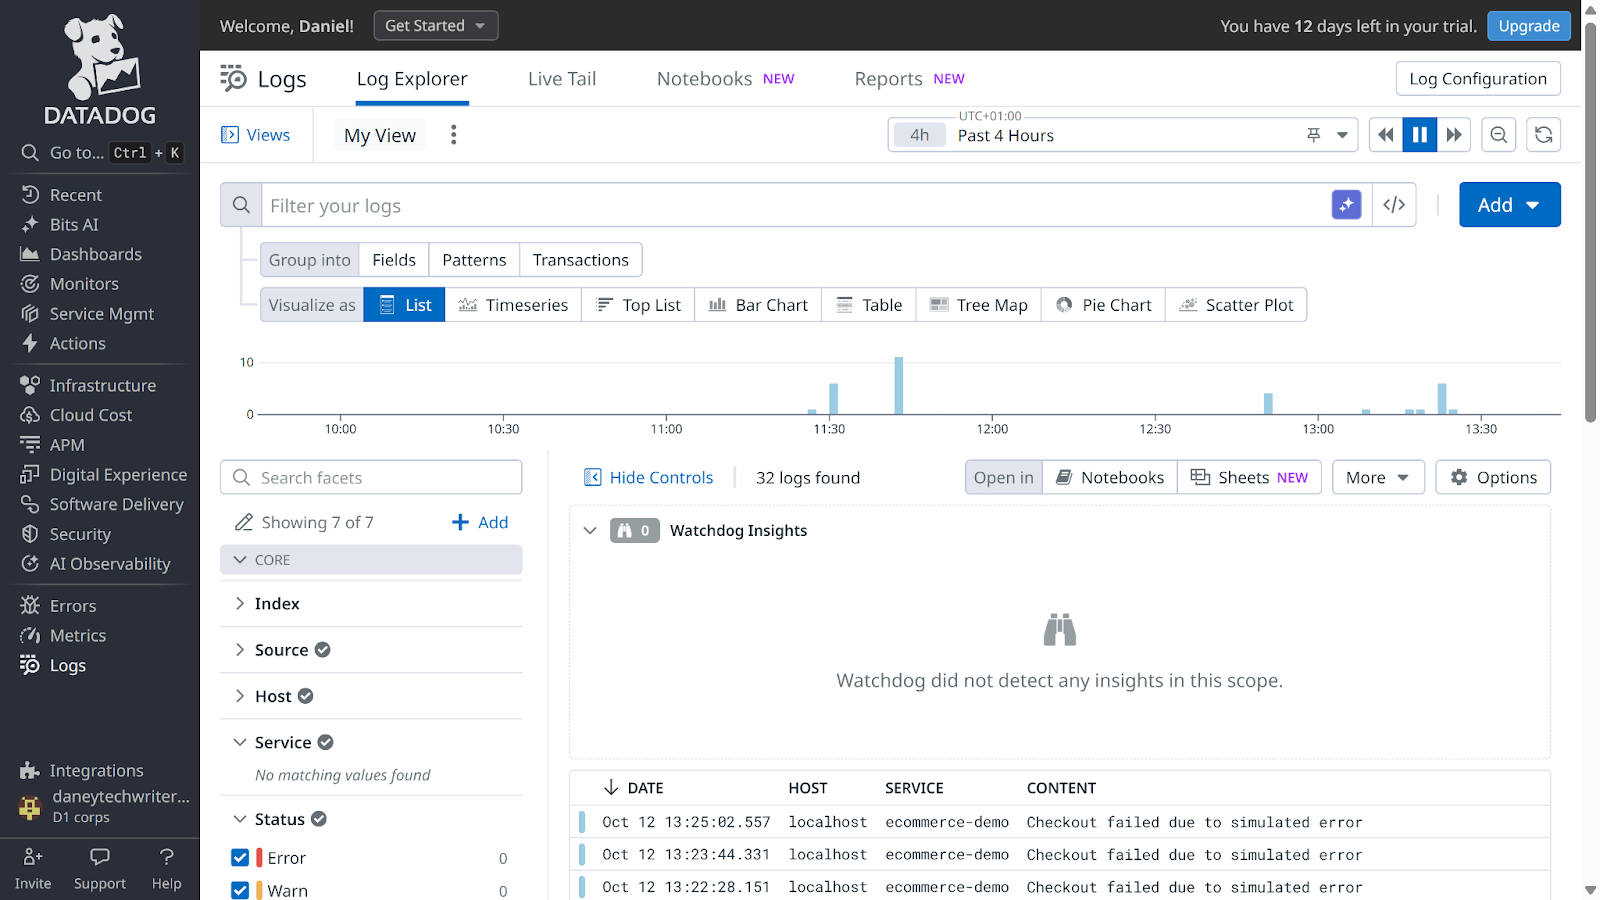
To confirm Datadog is correctly logging the errors from your project, head back to your Datadog dashboard → Logs → Live tail. You will see a log of all errors generated from your project.
Automating feature health with Flagsmith and Datadog
Now that your application successfully sends logs to Datadog, the next step is to monitor those logs and automatically update your feature status in Flagsmith based on the log data.
Flagsmith offers a robust system for tracking the operational state of features, termed Feature Health. This system displays the status of individual features on their respective dashboards, marking them as either Healthy or Unhealthy based on alerts received from connected observability tools.
By integrating Flagsmith with Datadog, you can automatically update the health status of your features whenever Datadog detects anomalies such as increased error rates or performance degradation.
Integrating Flagsmith with Datadog involves two main steps:
- Creating a Datadog workflow.
- Creating a Datadog monitor and connecting it to your workflow.
Creating a Datadog workflow
To automate the update of your feature health status in Flagsmith, you need to create a Datadog workflow that can be triggered by an alert.
Datadog integrates with Flagsmith to automatically update a feature’s status using the feature health webhook URL as its endpoint.
To get this webhook URL, go to Project Settings → Feature Health. Select Sample as your provider name and click the Create button to continue.
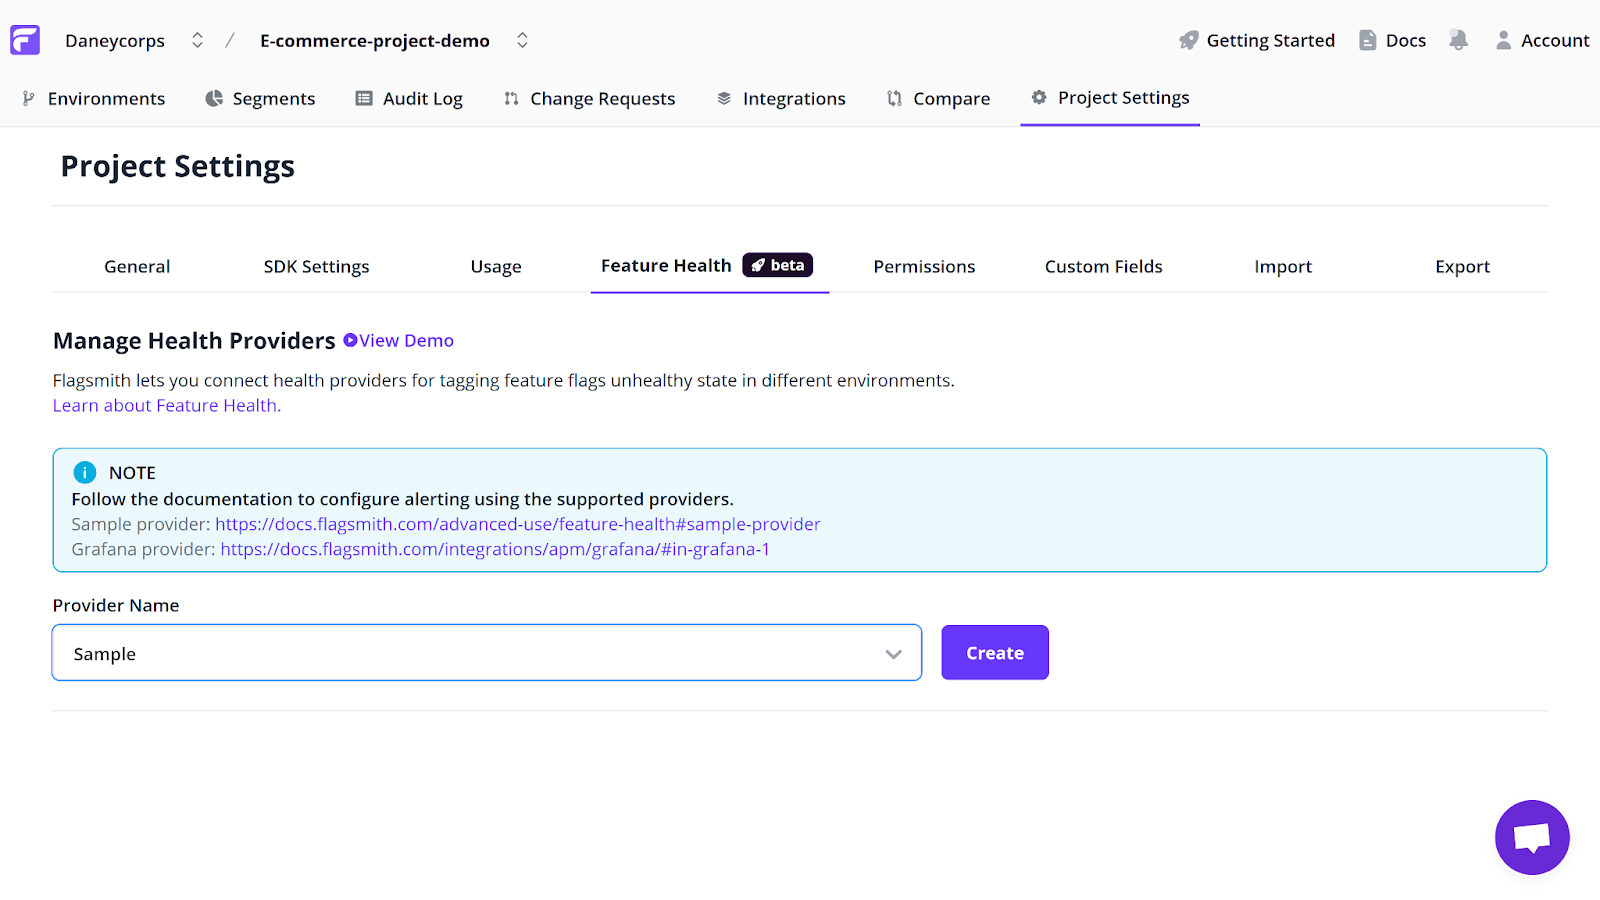
You will be provided with a unique webhook URL. Copy this URL, as it will serve as the endpoint for Datadog to interact with Flagsmith.
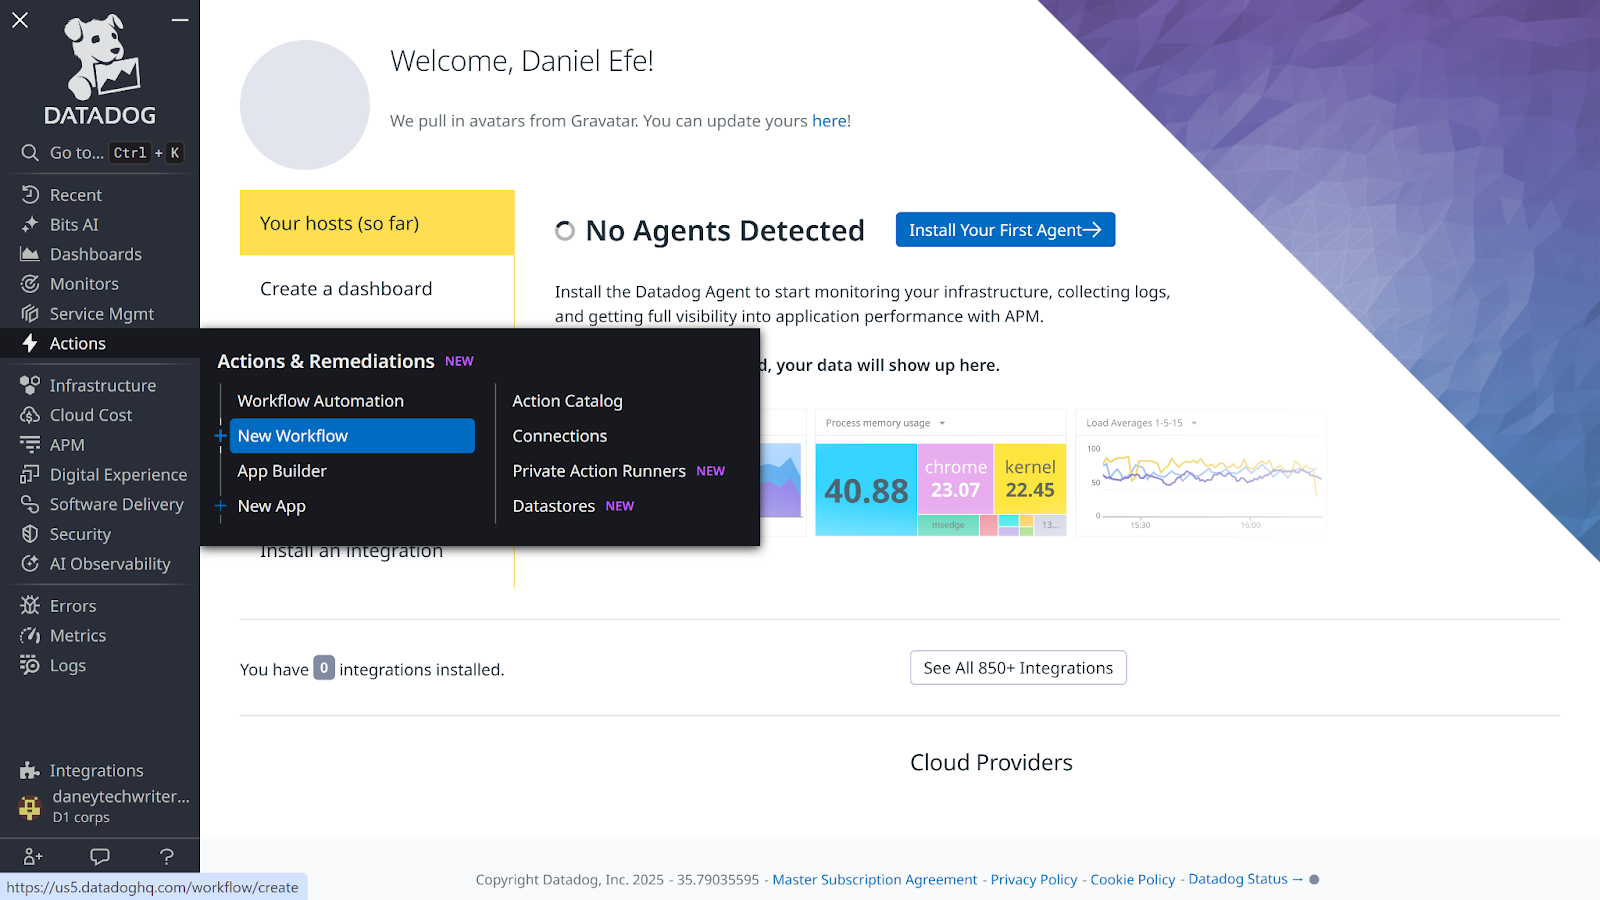
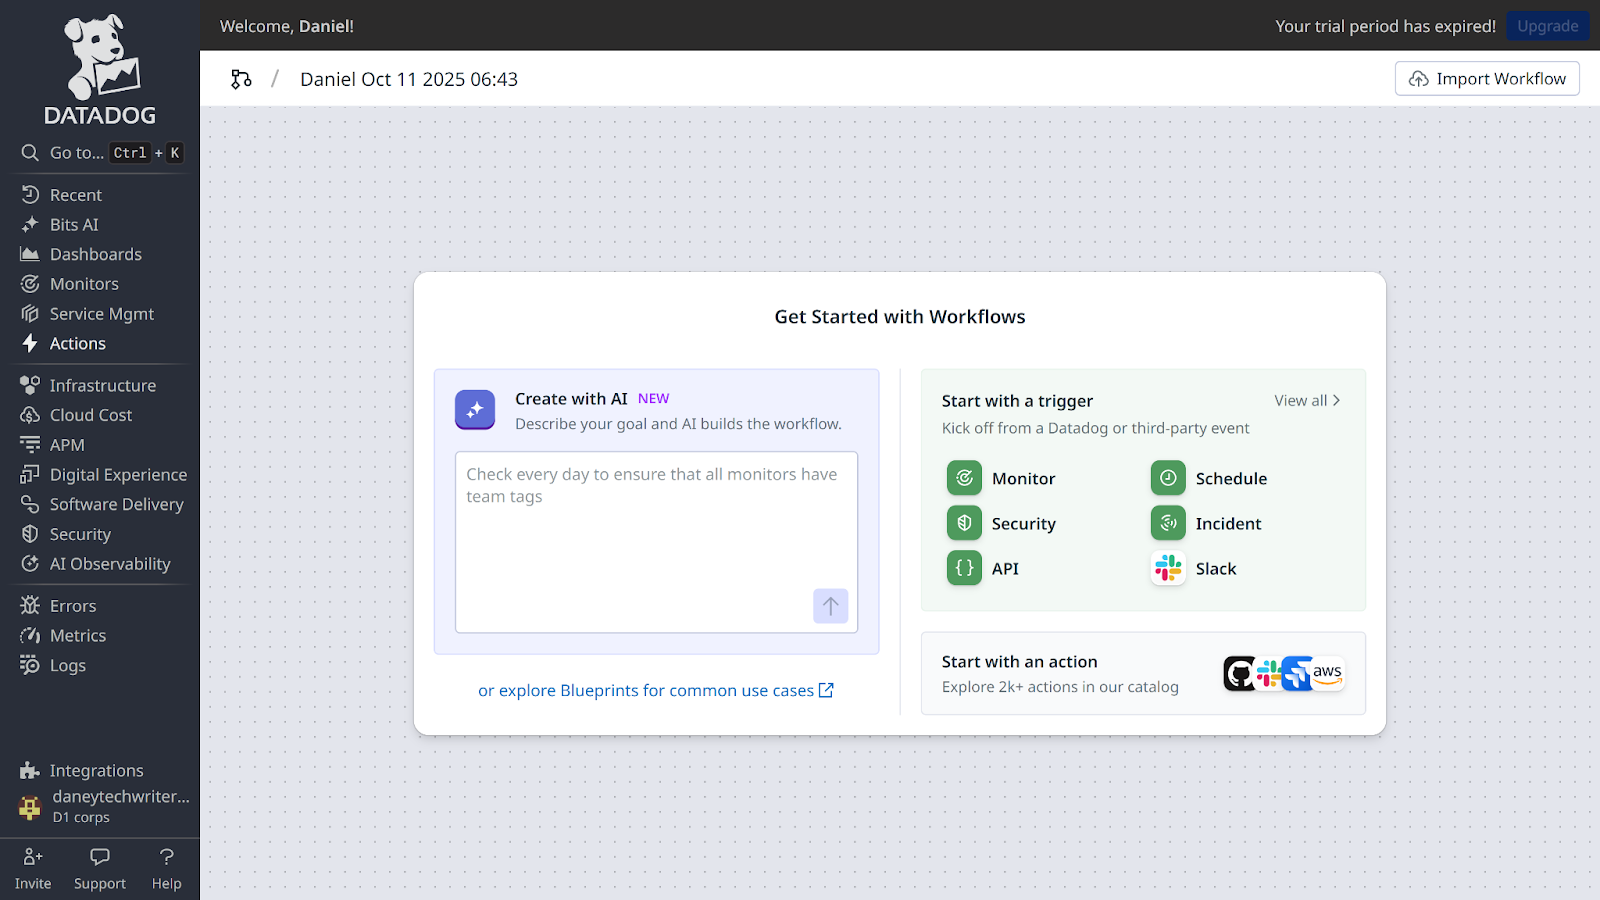
Proceed to Datadog to continue the integration. Within the Datadog UI, navigate to Actions & Remediations → New Workflow.
In the Start with a trigger section, select Monitor. This defines the event that will automatically trigger your workflow whenever specific conditions are met.
You will then be presented with the Workflow section UI. Click Create or connect steps to continue.

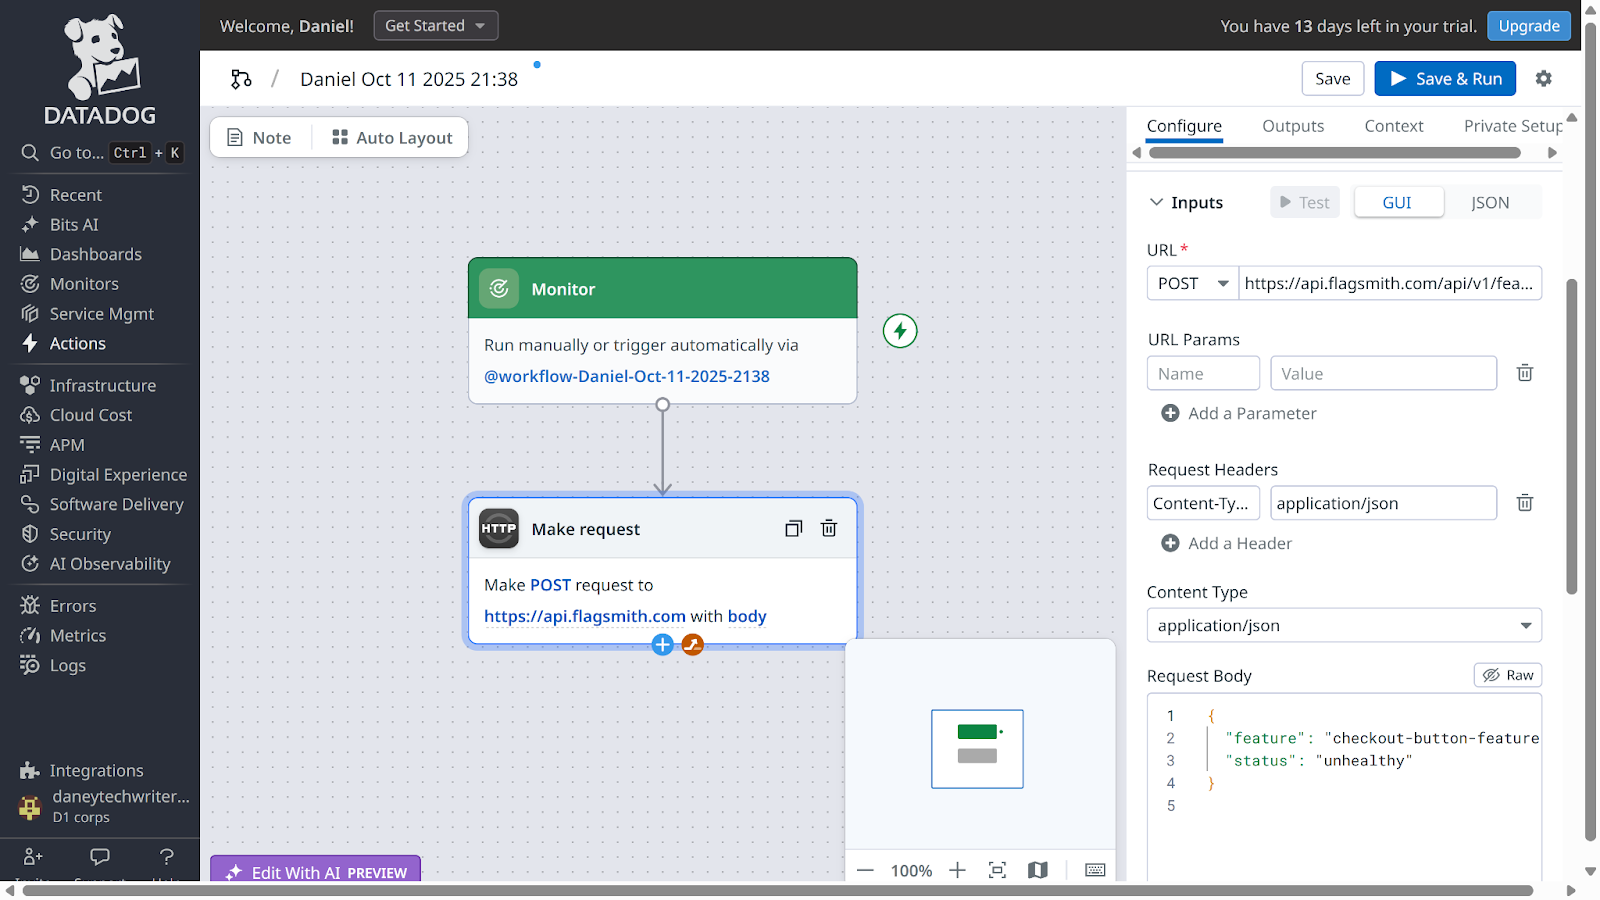
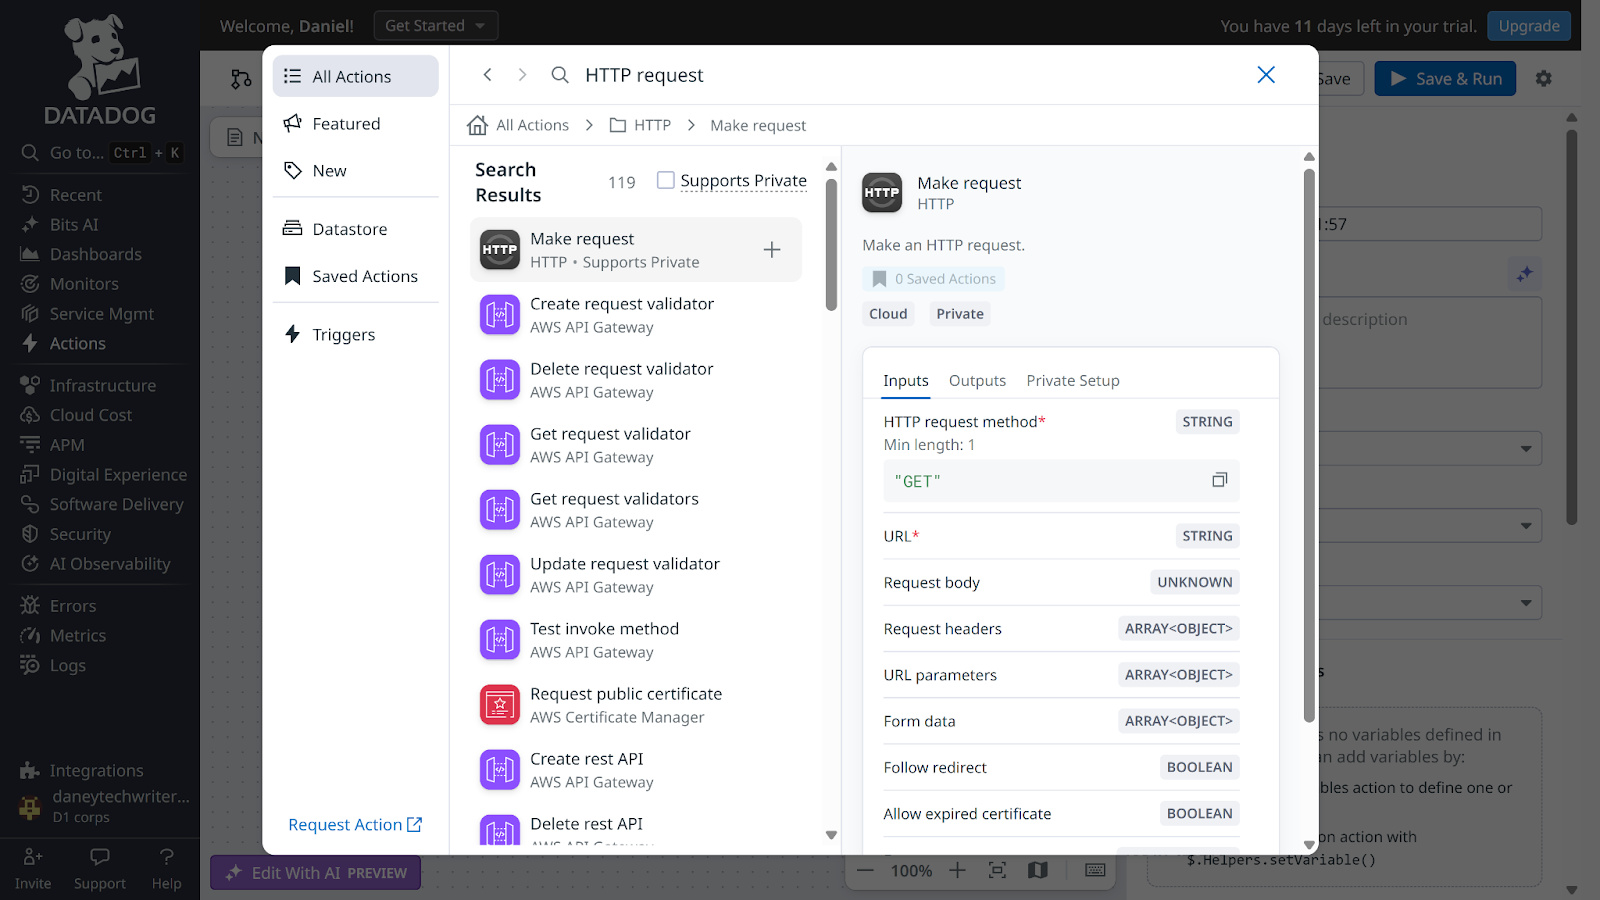
In the search bar, input HTTP Request and select Make request.
Fill in the following details in the Make request section:
- Method: POST
- URL: Your copied Flagsmith webhook URL.
- Content Type: application/json
- Request body:
{
  "feature": "NAME_OF_YOUR_FEATURE_FLAG",
  "status": "unhealthy"
}
Note: The request body explicitly tells Flagsmith to mark your feature flag as unhealthy when the Datadog monitor trigger fires. Remember to replace NAME_OF_YOUR_FEATURE_FLAG with the actual name of your Flagsmith feature flag.
Upon completion, click the Save & Run button to continue. You should see a confirmation indicating that your workflow ran successfully.
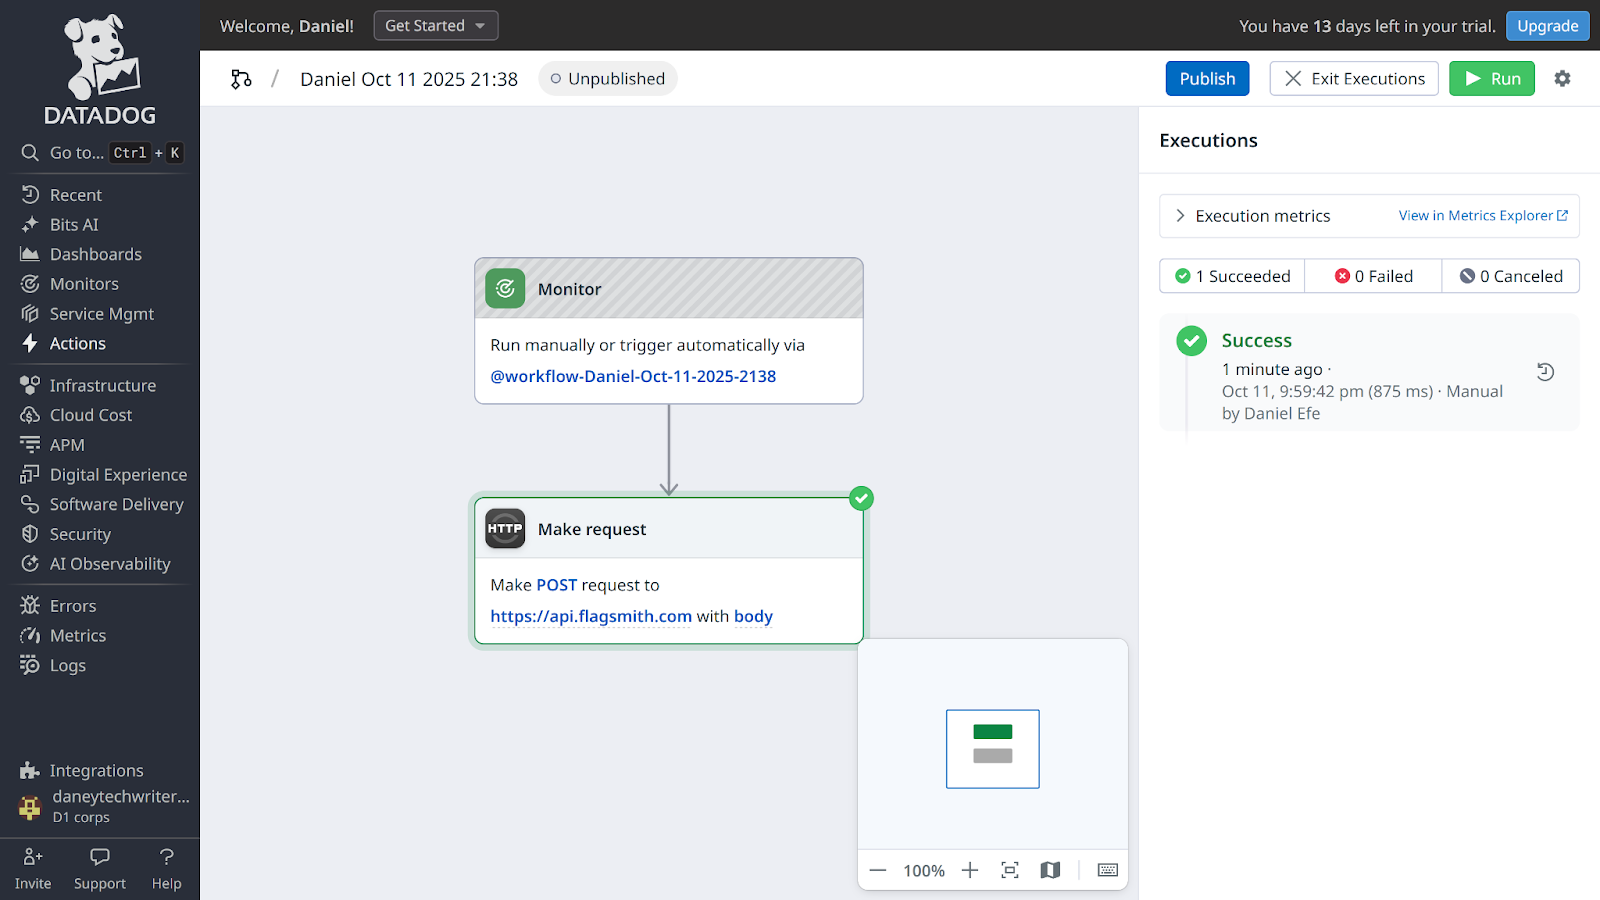
Finally, click Publish to finish the setup.
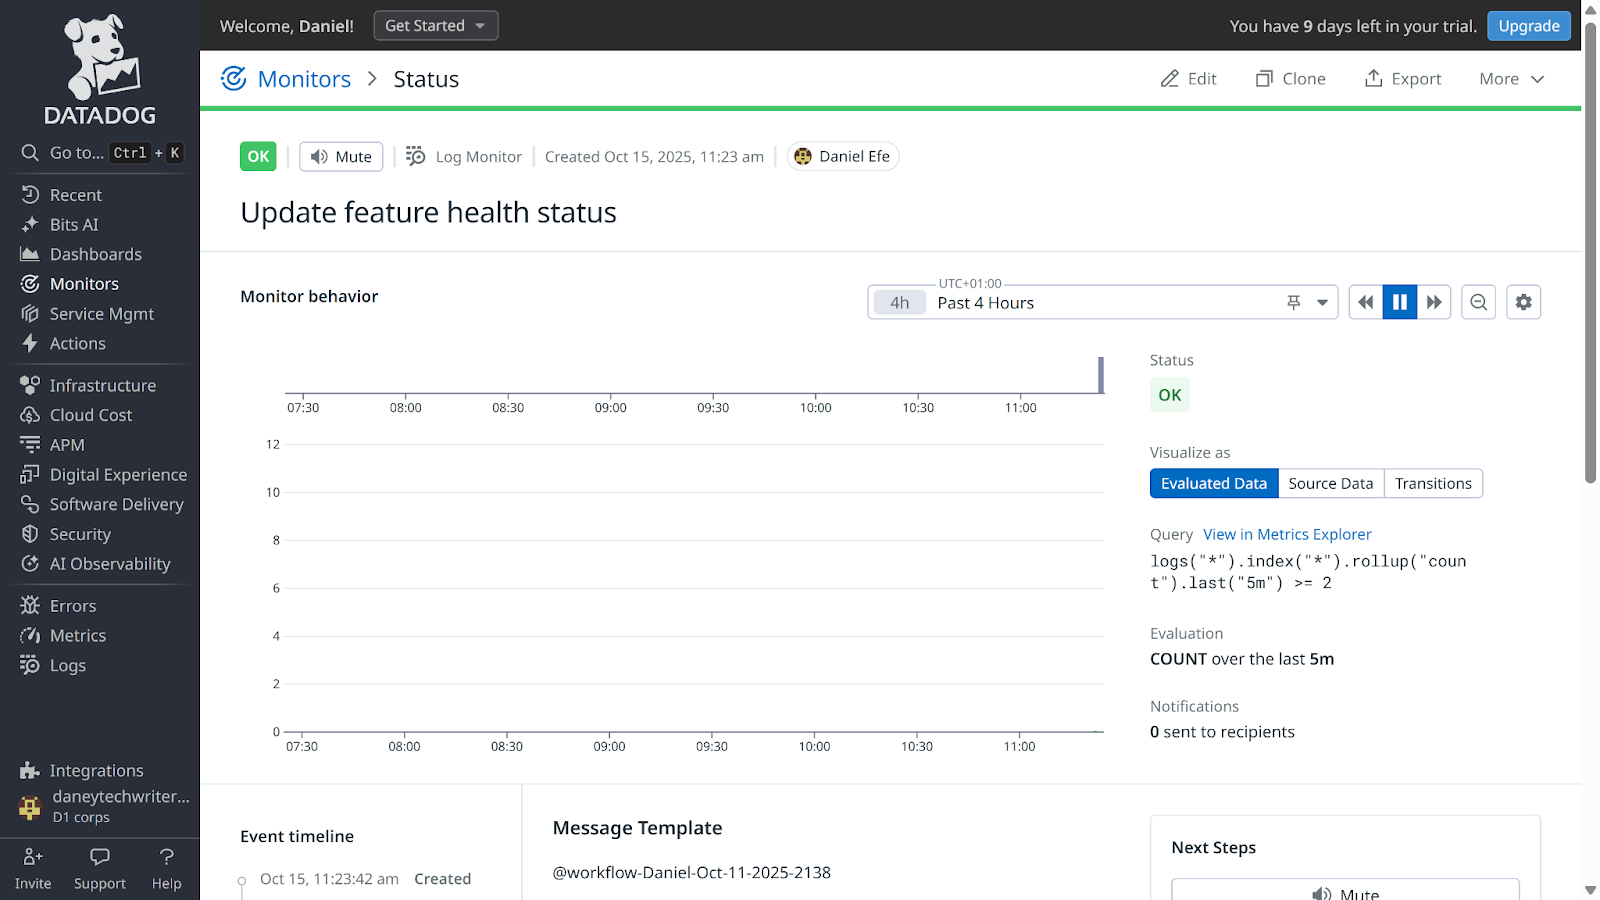
To confirm a successful configuration, navigate to your feature flag within the Flagsmith dashboard. You should see an update in your feature’s health status (though the automated trigger won't work fully until the Monitor is linked in the next steps).

At this point, the automated trigger won't work fully until the Monitor is linked in the next steps.
Creating a Datadog monitor
Now that your workflow has been created, you need to configure a Datadog monitor that will act as its trigger. This will ensure that your application logs are continuously analysed, and your workflow triggers automatically when conditions such as repeatedly generated errors are met.
To create a Datadog monitor, navigate to your Datadog dashboard → Monitors → New Monitors → Logs.
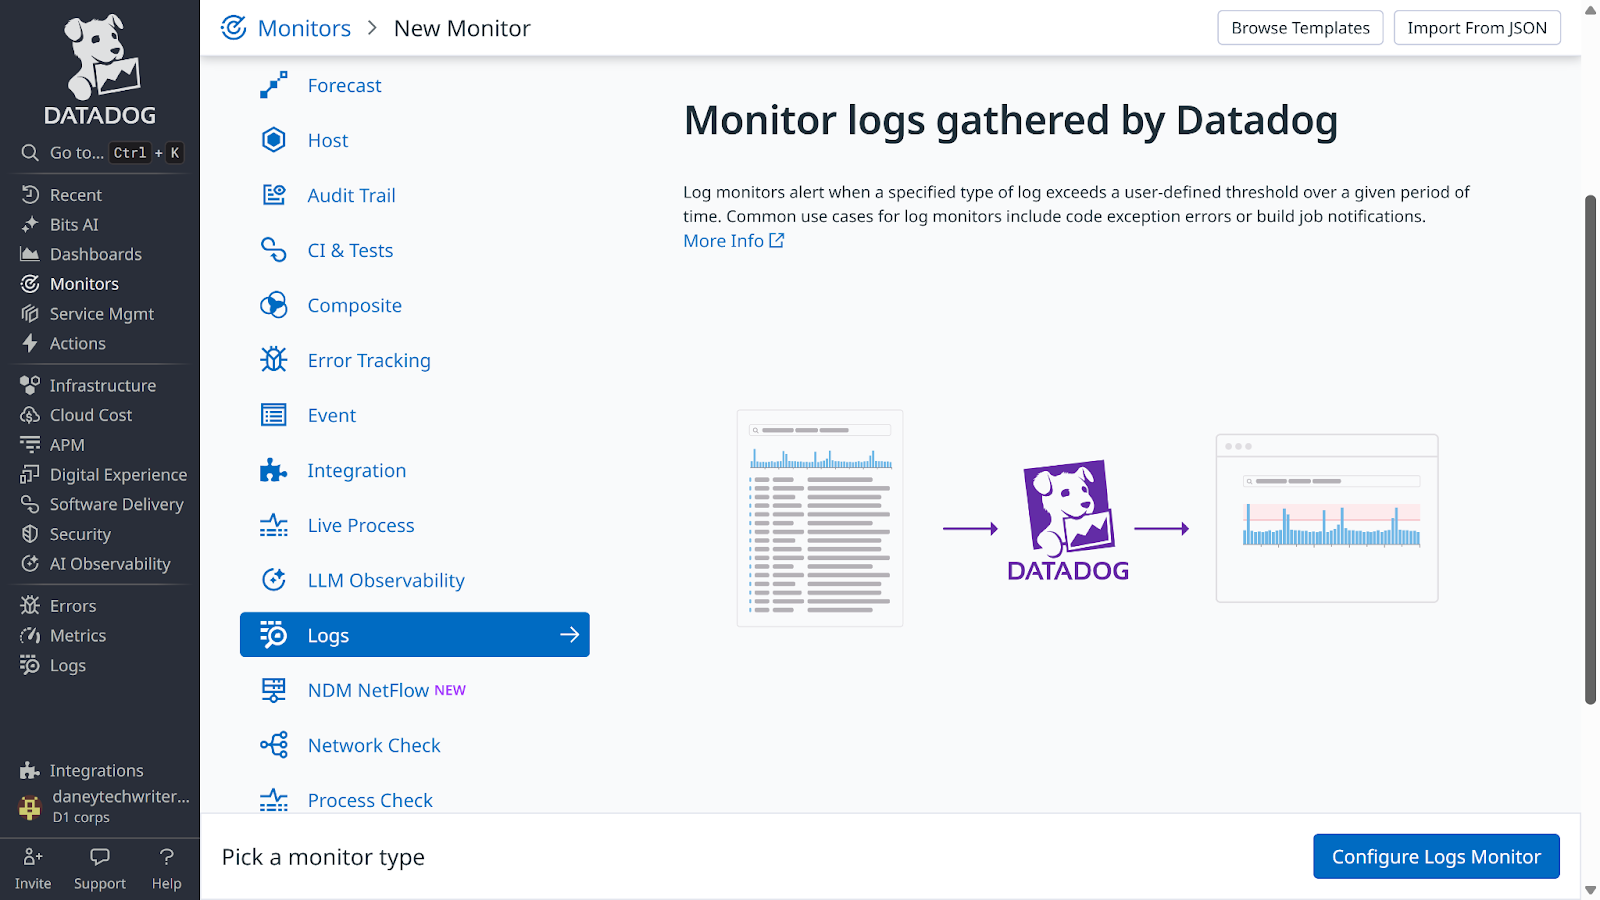
Proceed to the Select monitor scope section and define it as follows:
- Define the search query: env:demo service:ecommerce-demo status:error
- Evaluate the query over the: last 5 minutes
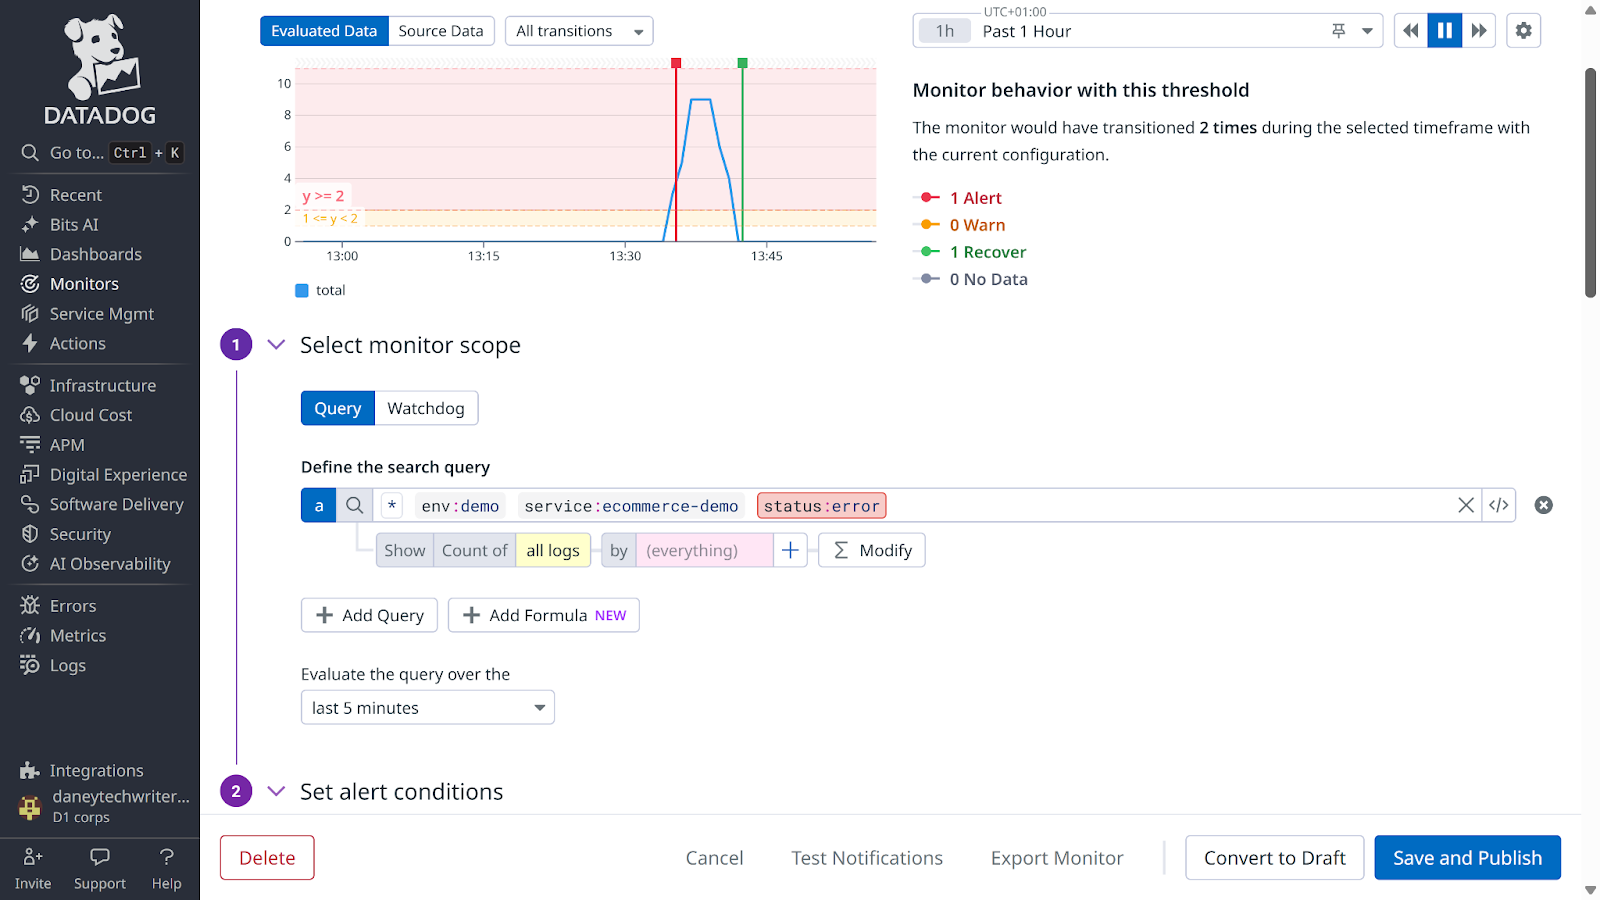
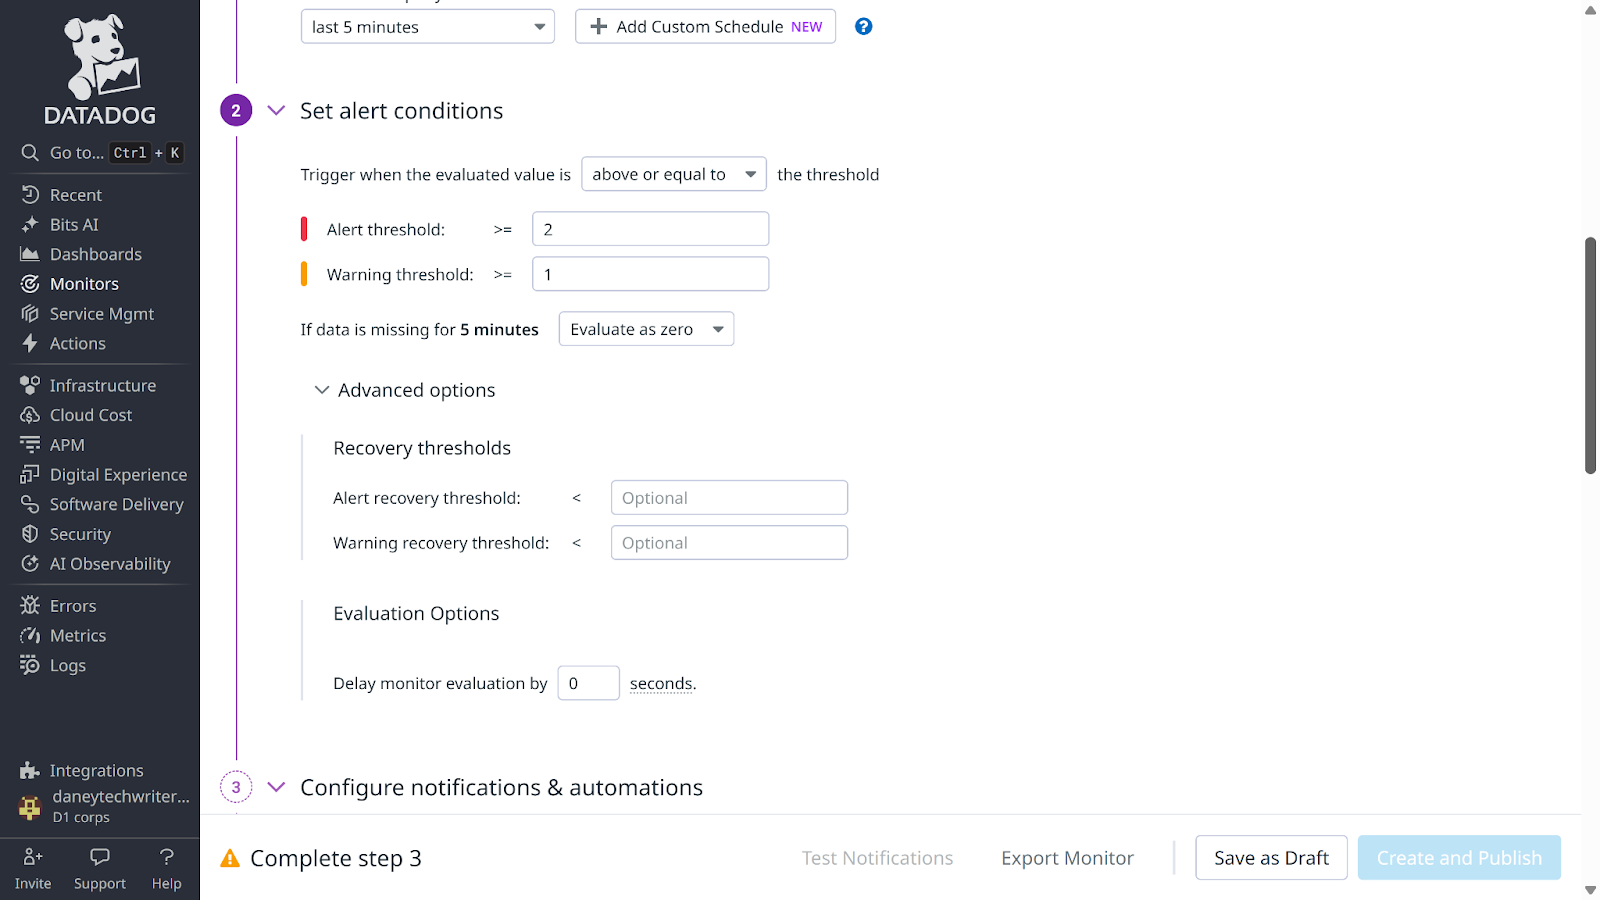
Next, proceed to the Set alert conditions section:
- Trigger when the evaluated value: above or equal to
- Alert threshold: >= 2 (This is the number of logs that trigger the alert).
- Warning threshold: >= 1
Scroll to the Configure notifications & automations section and enter a valid name for your monitor (this tutorial uses Update feature health status as the monitor name)
Proceed to the Trigger workflow section and click the Add workflow button to continue.
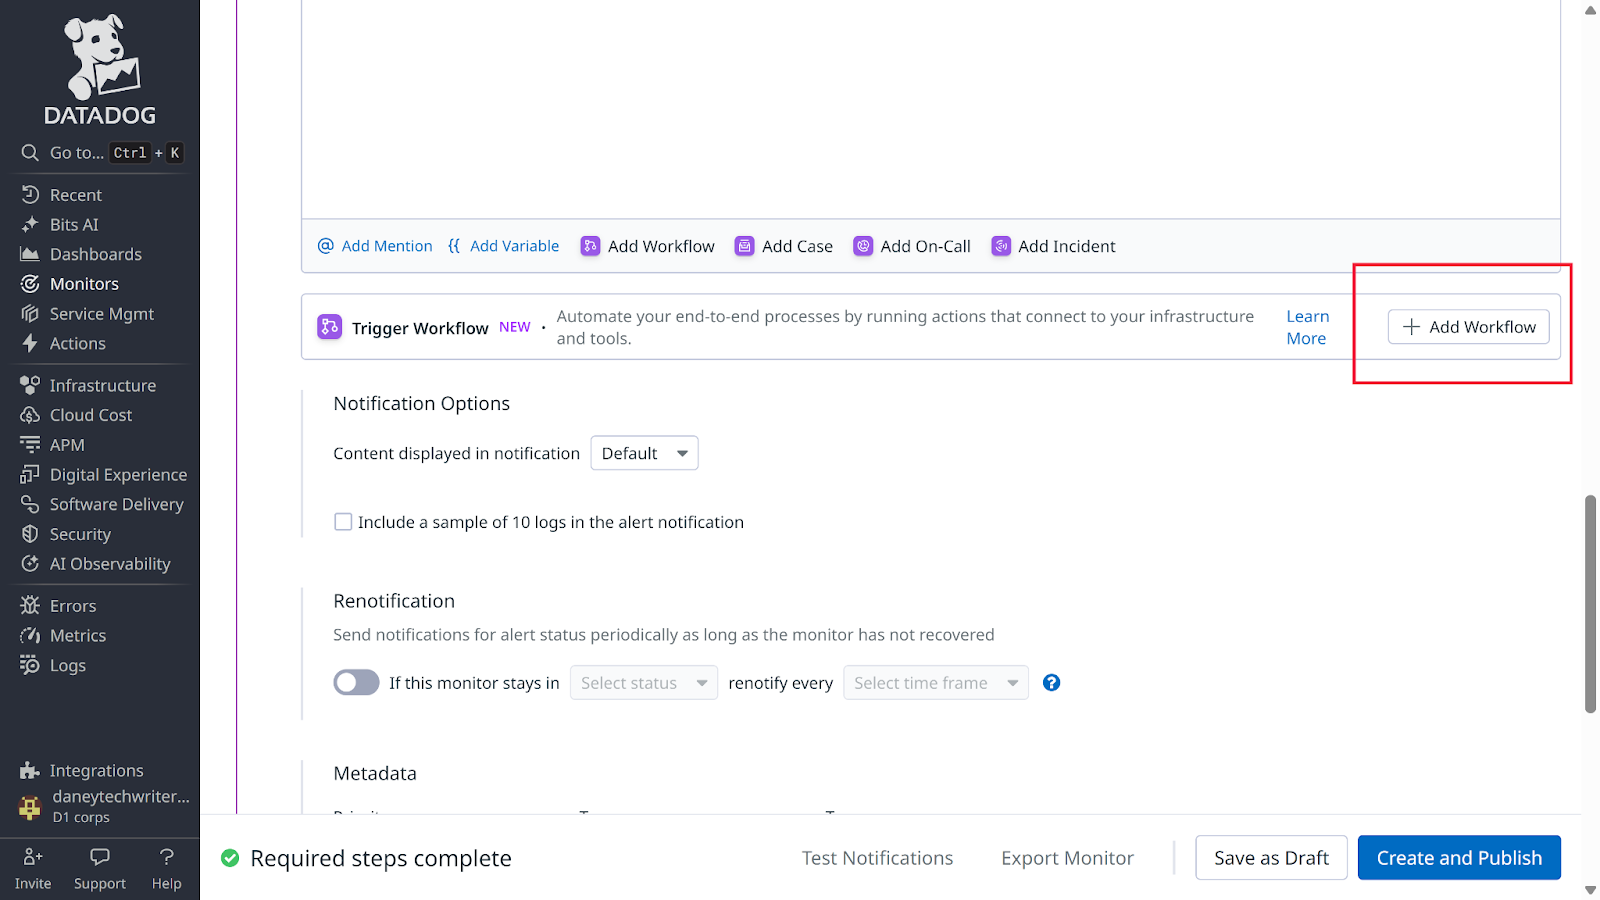
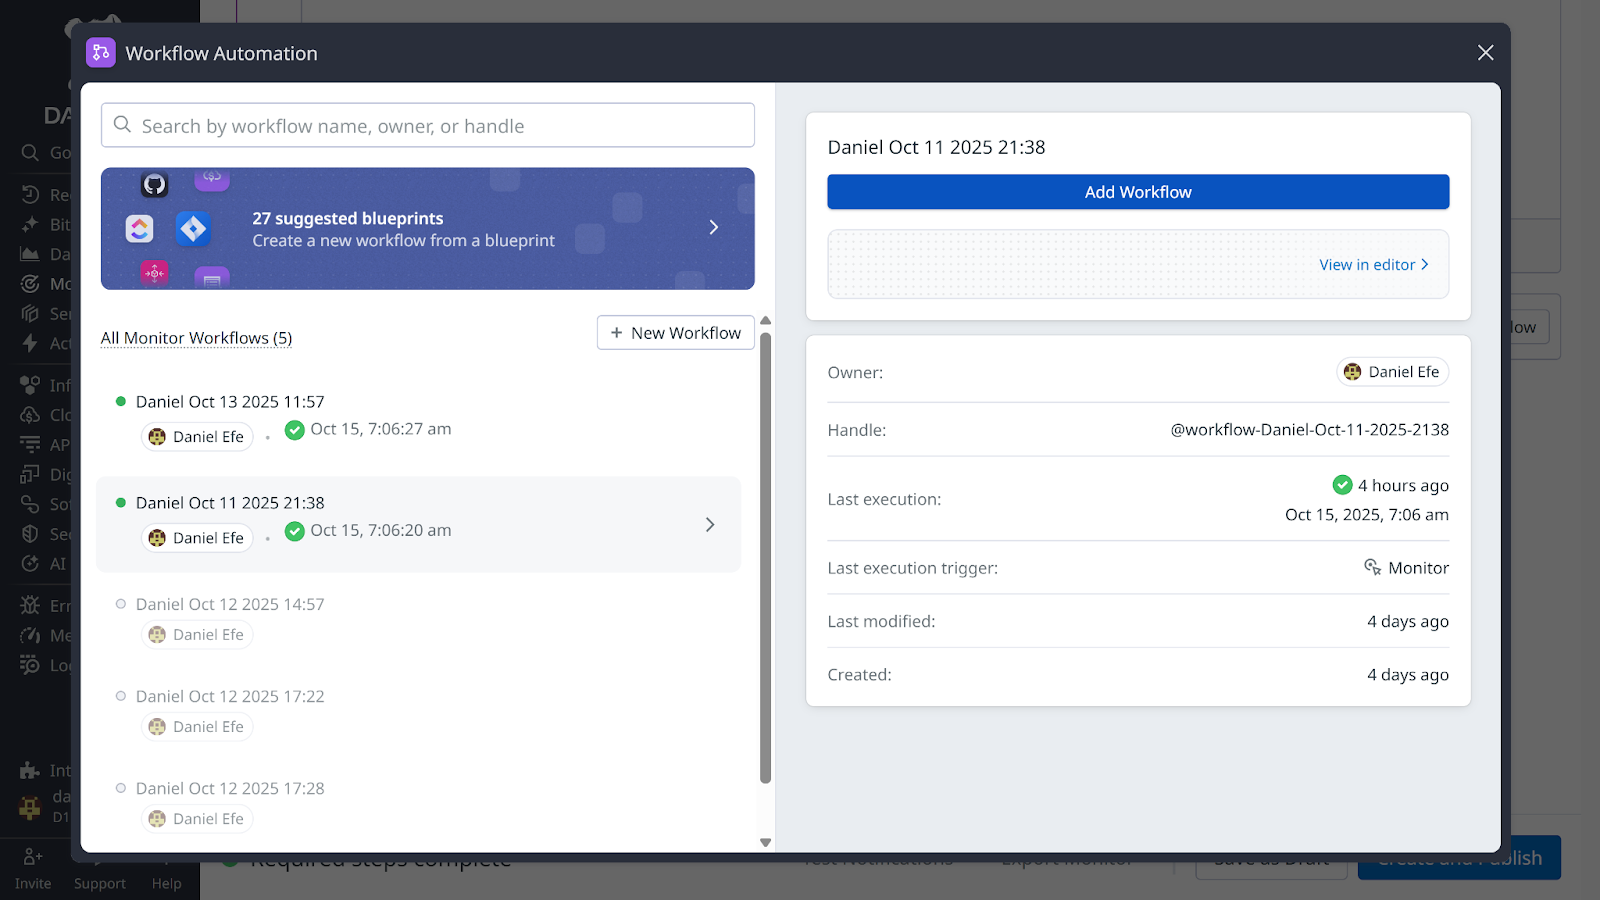
Select Choose existing workflow and pick the workflow you just created in the previous step. Click Add workflow again to confirm the selection.
Finally, publish your monitor by clicking the Create and Publish button. You will be redirected to your monitor dashboard.
To test your automation workflow, proceed to your project terminal and enter the following command:
curl -X POST "http://localhost:3000/api/v1/checkout?simulate_error=true"You will receive a “Checkout failed due to simulated error” message. Trigger the error a few more times (at least twice), then navigate to your Monitor dashboard. Within a minute or two, you should see it transition to an Alert state.
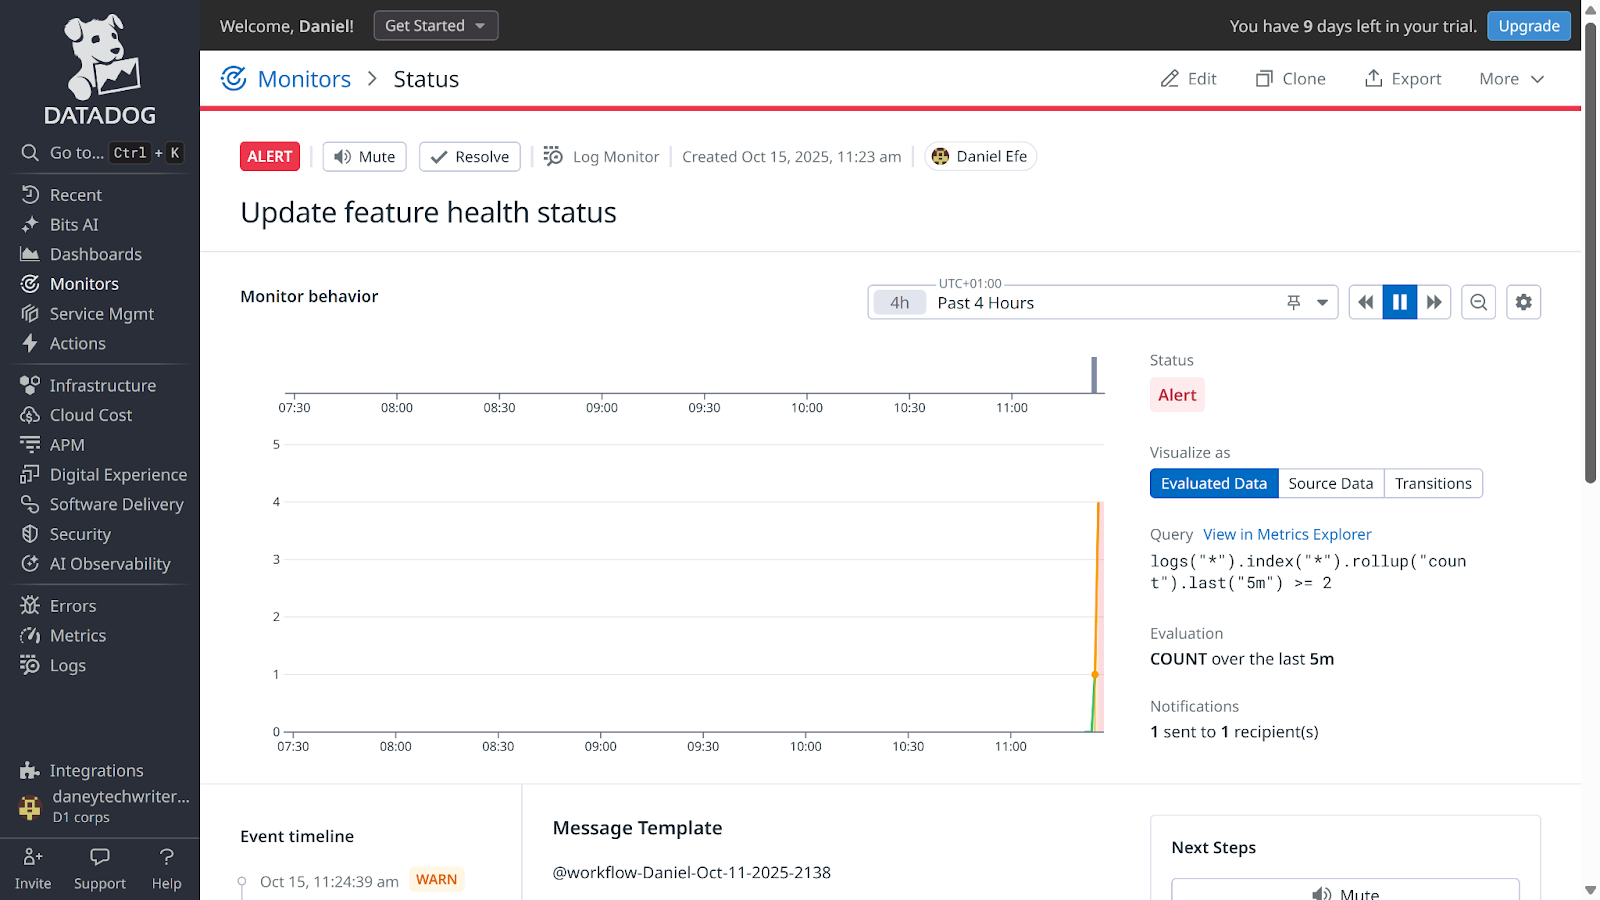
Proceed to your Features dashboard in Flagsmith. You will find your feature health status updated to Unhealthy, confirming your automation workflow is working correctly.
Automatically disabling feature flag on error spike
With a workflow that automatically marks a feature as unhealthy when the error rate reaches a certain threshold, you can further extend this by configuring it to automatically disable flags when error rates are extremely high.
To achieve this, you will first create a workflow that interacts with the Flagsmith REST API.
To create such a workflow, you will require the following:
- A Flagsmith organisation API key.
- Flagsmith API base URL: https://api.flagsmith.com/api/v1/
- Flagsmith environment ID (the same value as your client-side environment key)
- Your Flagsmith feature name (this tutorial uses checkout-button-feature)
- Your feature_state ID
To get your Flagsmith organisation API key, navigate to your Flagsmith dashboard → Organisation Settings → API Keys.
Click on the Create API Key button, then input a valid API Key name (this tutorial uses Project API key) and click Create to continue.
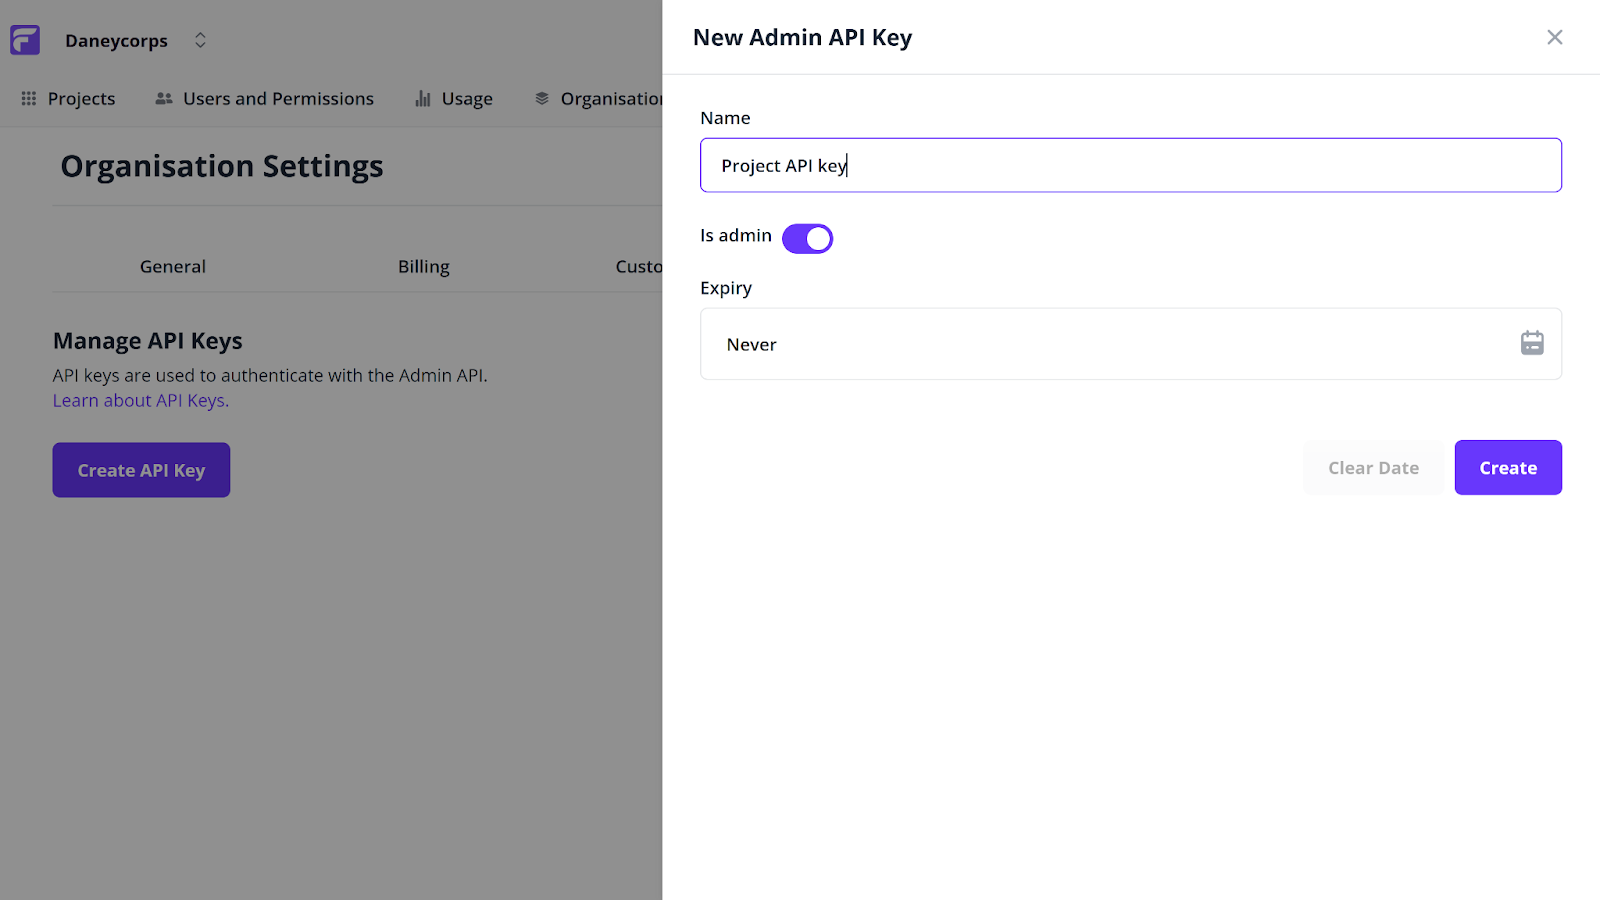
Copy the key and proceed to create your Datadog workflow.
Note: The feature_state ID is also required to automatically disable flags when anomalies are detected. Therefore, before configuring the workflow that automatically disables the flag on an error spike, you first need to retrieve the feature_state ID.
Step 1: Retrieve your feature_state ID
To get your feature_state ID, navigate to the Datadog dashboard → Actions & Remediations → New Workflow → Monitor.
Next, click on create or connect step, input HTTP Request into the search bar, select Make request, and continue.
In the Make request section, fill in the following details:
- Method: Get
- URL: https://api.flagsmith.com/api/v1/environments/<YOUR_ENVIRONMENT_ID>/featurestates/?feature_name=<YOUR_FEATURE_FLAG_NAME>
- Request Headers:
Create a header and set:
- Name: Authorization
- Value: Api-Key <YOUR_ORG_API_KEY>
Click the add a header button and fill in:
- Name: Content-Type
- Value: application/json
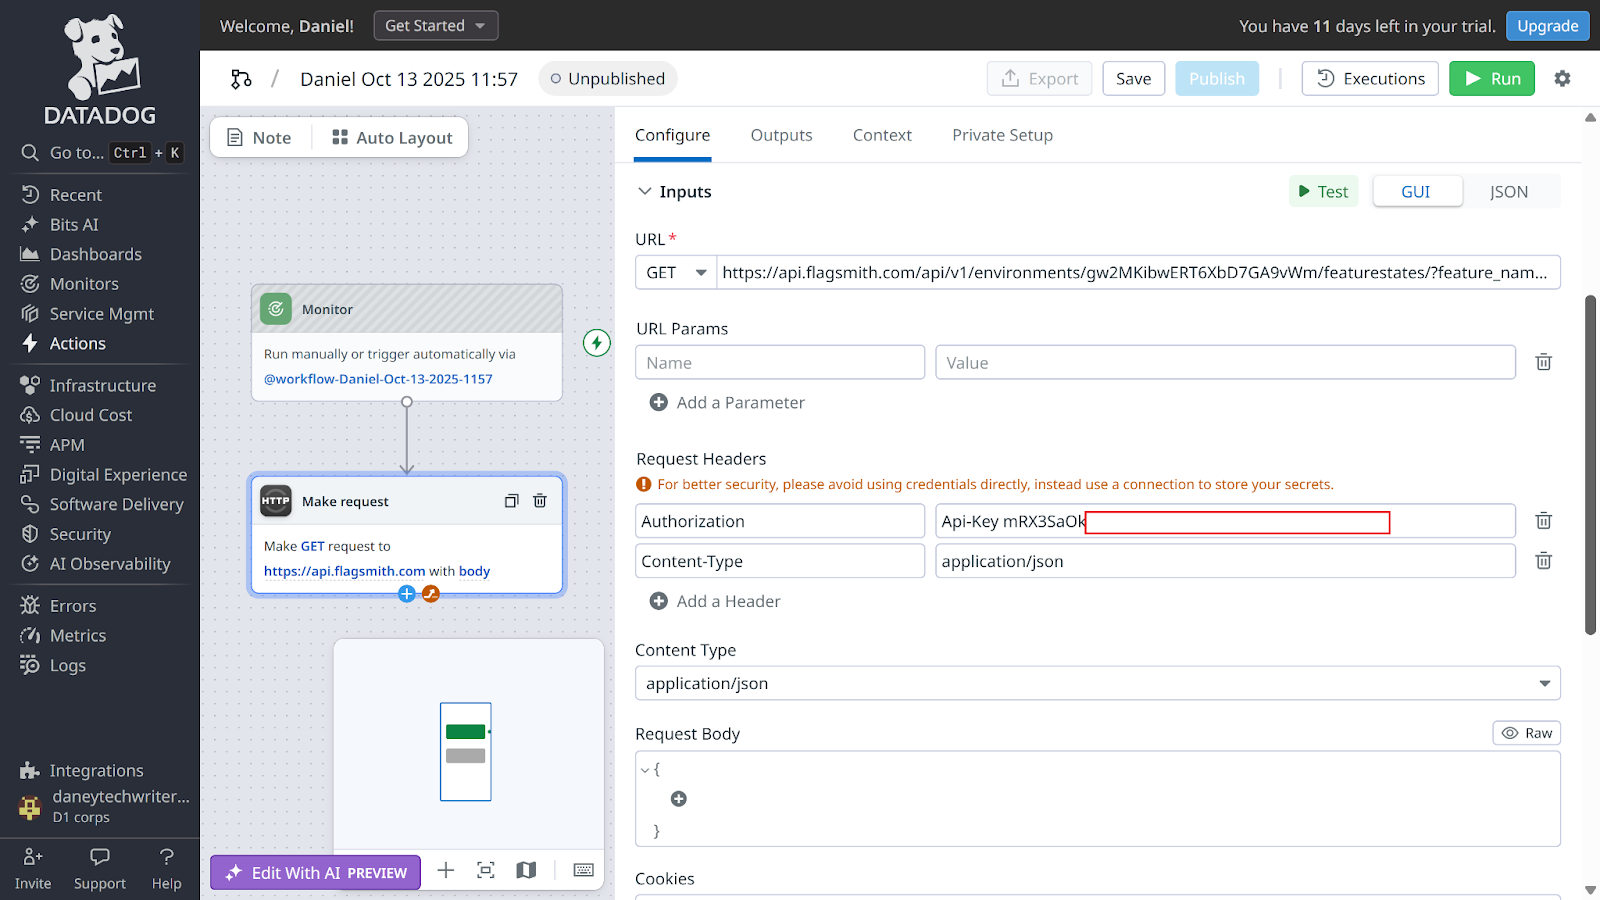
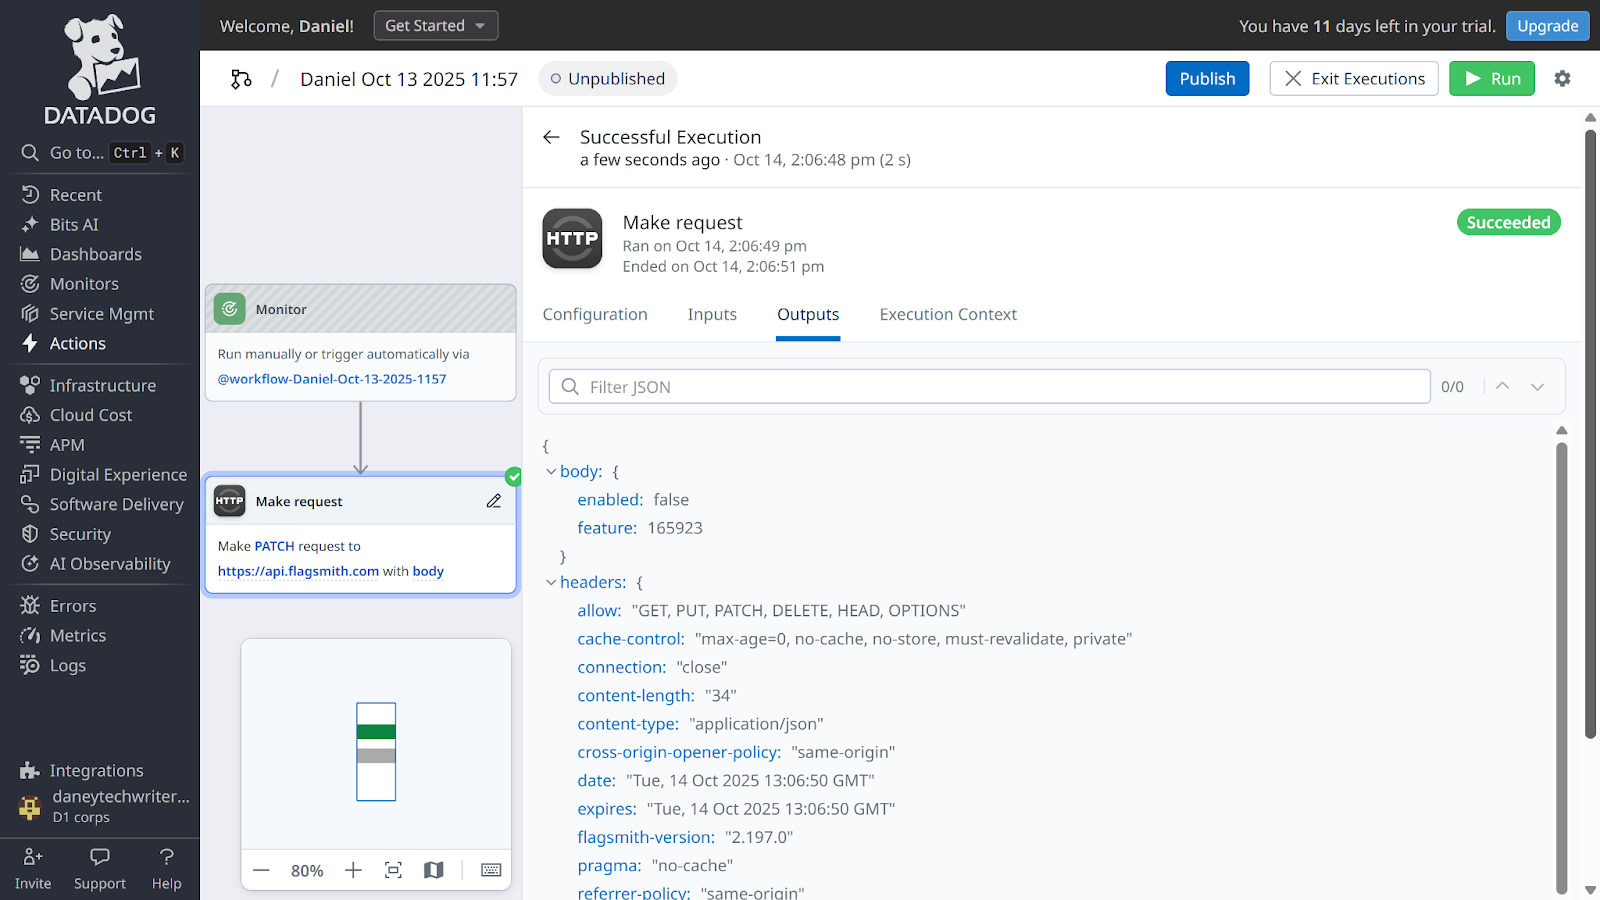
Click Test. You will receive a test result. Expand the results section and scroll until you see an id tag. That value will serve as your feature_state_id.

Step 2: Update workflow to utilise feature_state ID
Copy your feature_state ID and edit your workflow as follows:
- Method: Patch
- URL: https://api.flagsmith.com/api/v1/environments/<YOUR_ENVIRONMENT_ID>/featurestates/<YOUR_FEATURE_STATE_ID>/
- Request Body:
{
  "enabled": false
}
Click the Save & Run button to continue. You should get a successful workflow result. You can verify this by checking if your Flagsmith feature is disabled on your Flagsmith feature dashboard.
Finally, finish by clicking the Publish button to publish your workflow.
Connecting your Datadog monitor
So far, you have succeeded in creating a workflow that disables your Flagsmith feature manually. However, to trigger this workflow automatically when error rates exceed specific thresholds, you need to connect your workflow to a monitor.
To do this, navigate to your Datadog dashboard → Monitors → New Monitors → Logs.
In the Select monitor scope section, fill in the following:
- Define the search query: env:demo service:ecommerce-demo status:error
- Evaluate the query over the: last 5 minutes
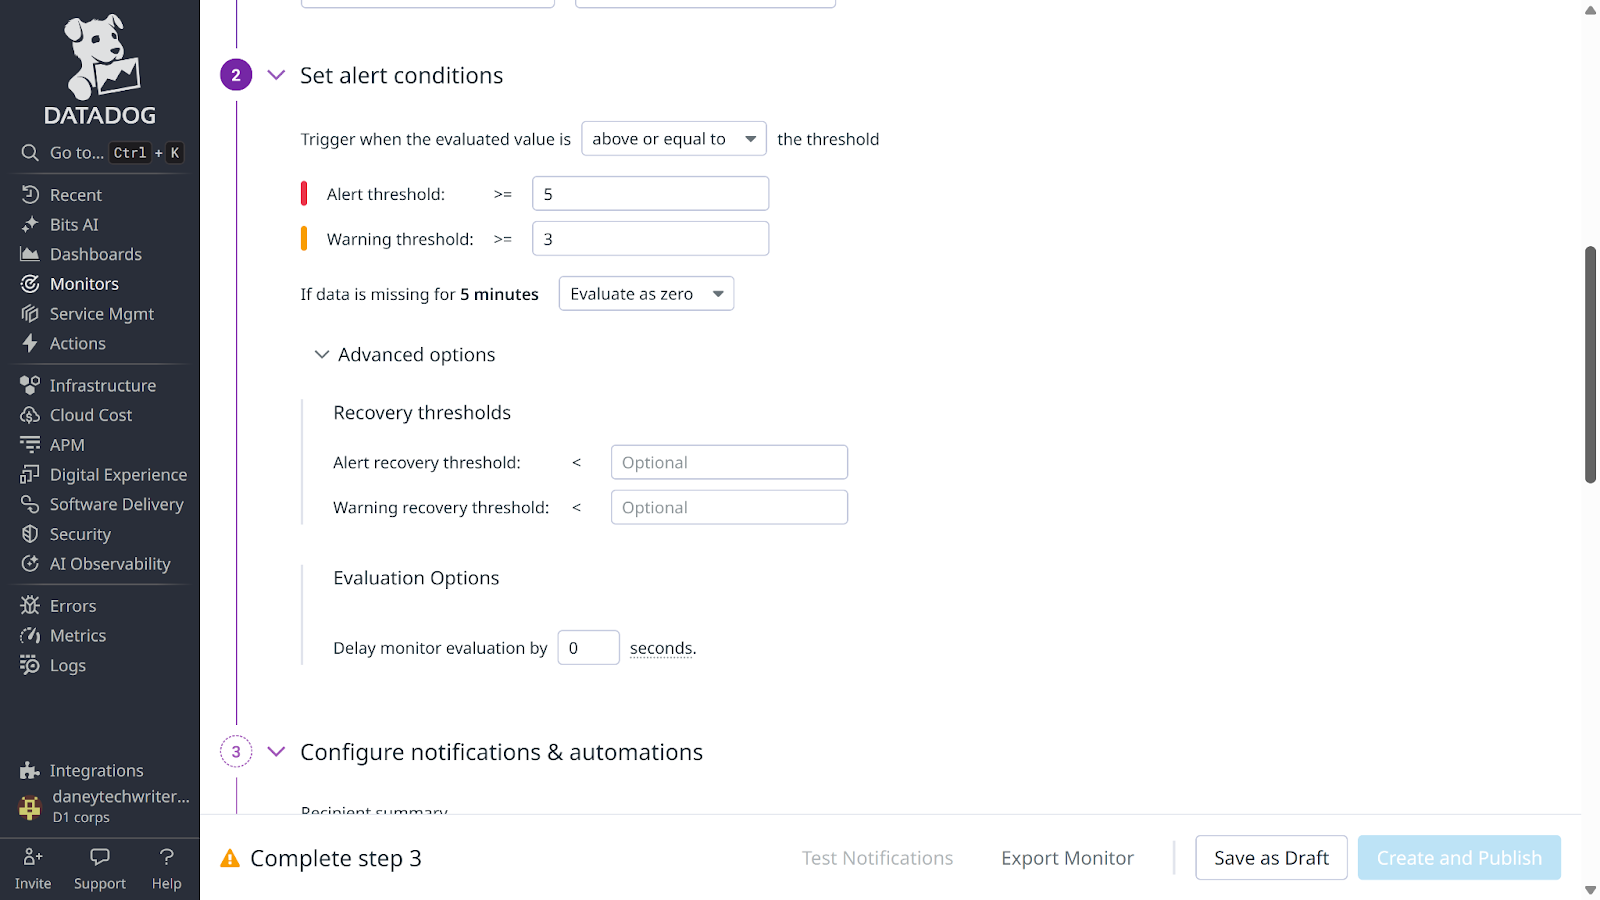
Next, scroll to the Set alert conditions and update as follows:
- Trigger when the evaluated value is: above or equal to
- Alert threshold: >= 5
- Warning threshold: >= 3
Next, scroll to the Configure notifications & automations section and input a monitor name (this tutorial uses Toggle feature flag).
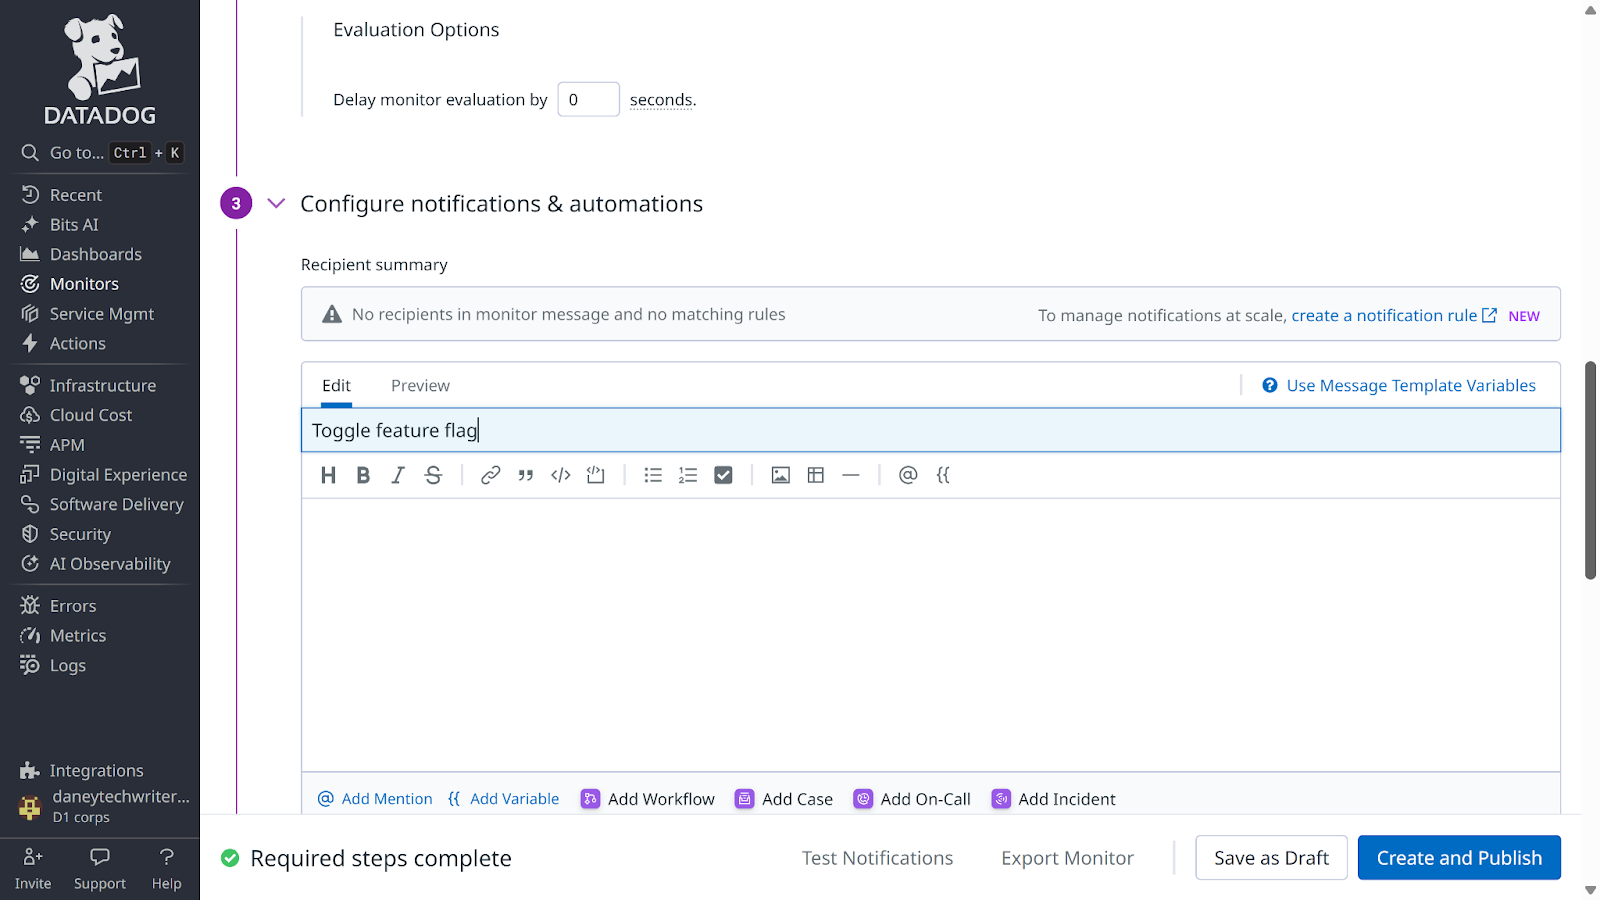
Next, head to Trigger Workflow and click the Add Workflow button.
Select Choose Existing Workflow, pick your newly created workflow, and click Add Workflow to continue.

Finally, click the Create and Publish button to publish your monitor. You will be redirected to your monitor dashboard.

To test your workflow, you need to generate multiple errors (errors exceeding five) in your application. To do this, enter the following command in your terminal:
curl -X POST "http://localhost:3000/api/v1/checkout?simulate_error=true"You will receive a "checkout failed due to simulated error" message. Repeat the process a couple of times (exceeding five times) and head to your monitor dashboard. You will find your monitor in an alert state and a notification sent.

Checking your feature flag in Flagsmith, you will find your feature with an unhealthy status and the flag toggled off.

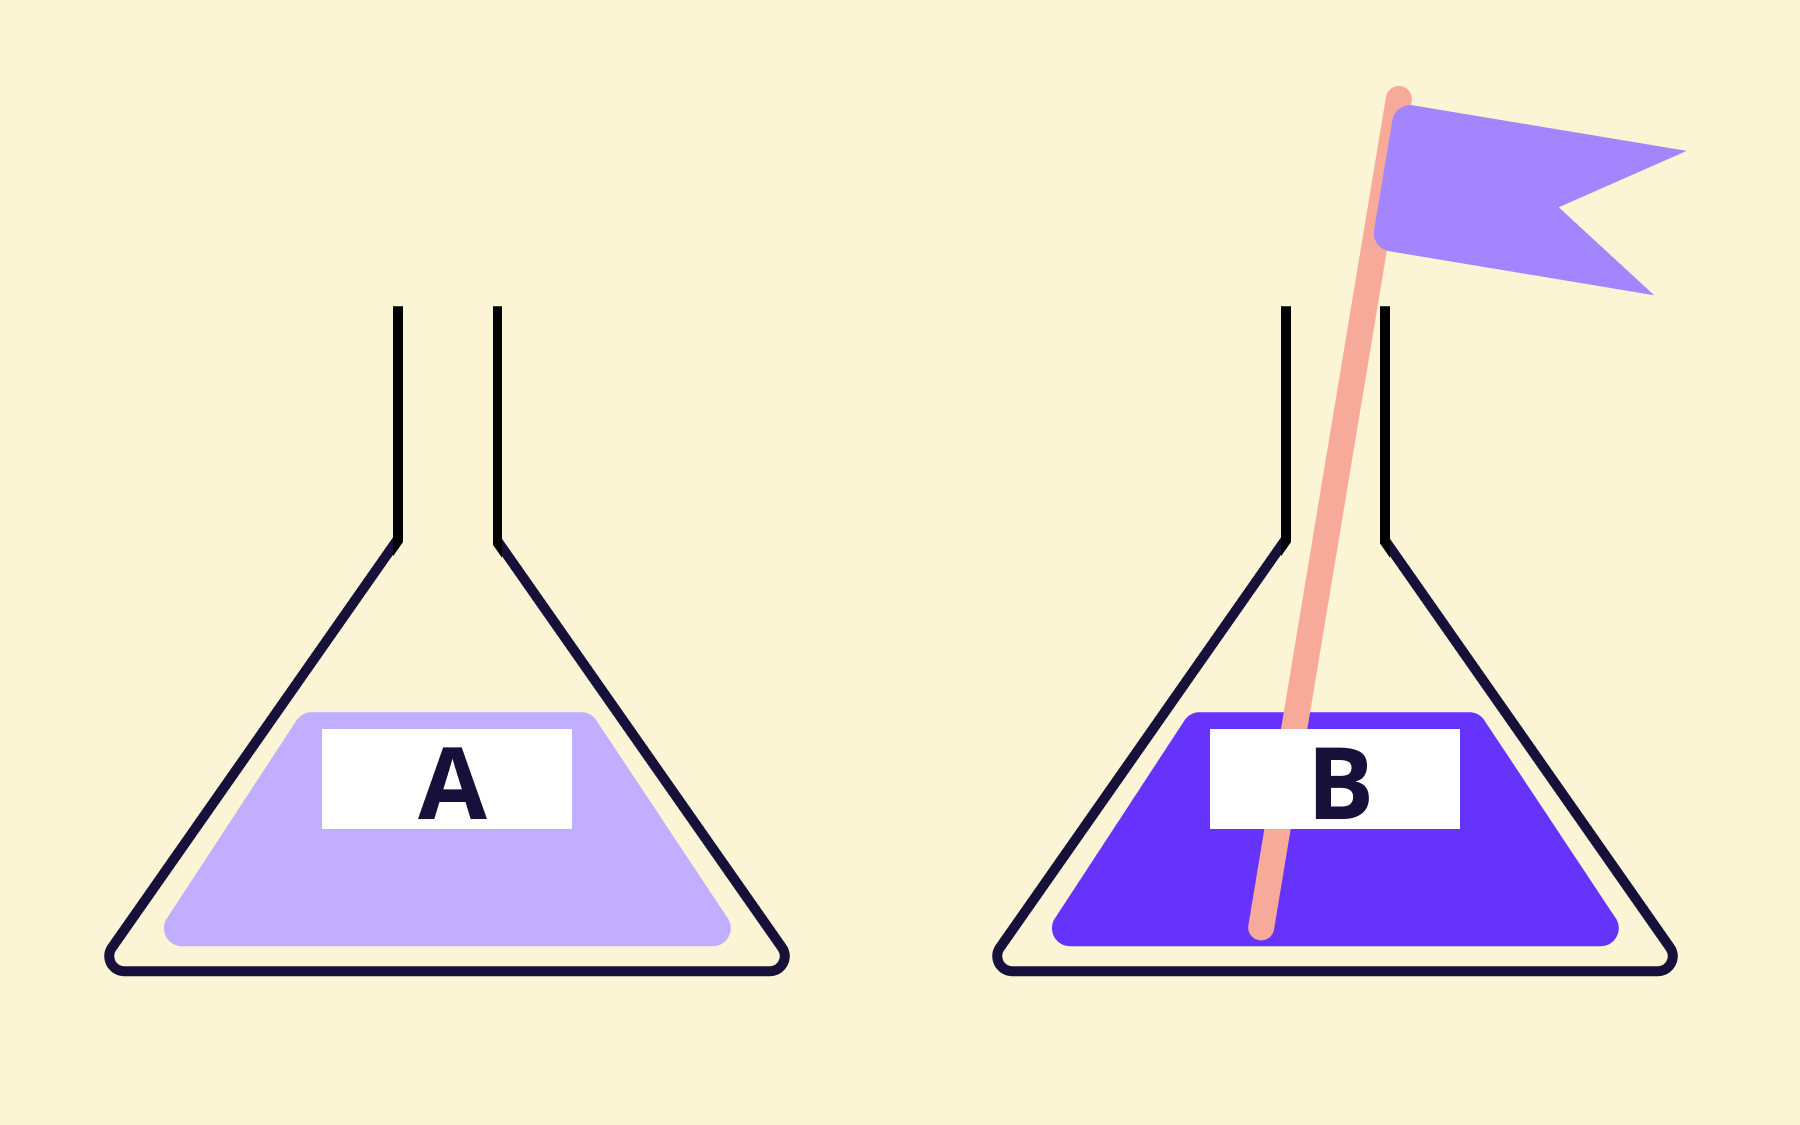
Possible extension: managing segmented rollouts with Datadog
In addition to updating the status of your feature health and disabling flags during high error spikes, you can extend your workflow by utilising Datadog for segmented rollouts.
This allows you to automate the process of reducing rollout percentages when error spikes are recorded for a monitored feature.
To utilise Datadog for managing segmented rollouts, you need to:
1. Set up feature segmentation using Flagsmith.
2. Create a datadog workflow:
This workflow should trigger an HTTP request to the Flagsmith REST API to adjust percentage rollout dynamically.
The request should be structured as follows:
- Method: Put
- URL: https://api.flagsmith.com/api/v1/projects/<PROJECT_ID>/segments/<SEGMENT_ID>/
- Headers:
Create an header and set the:
- Name: Authorization
- Value: Api-Key <YOUR_ORG_API_KEY>
Create a second header and set the:
- Name: Content-Type
- Value: application/json
- Request body:
Your Request body should reflect the percentage of users you want the feature to be available for upon error detection. It should be structured as follows:
{
  "rules": [
    {
      "type": "PERCENTAGE_SPLIT",
      "rules": [],
      "conditions": [],
      "value": 20
    }
  ]
}
Note: The above request body updates the rollout to 20%, allowing only that percentage of users to continue seeing the feature when error spikes are detected.
3. Create a Datadog monitor and connect your workflow to it.
Conclusion
In this tutorial, you learned how to gate features with Flagsmith and implement a workflow that integrates Flagsmith with Datadog. This setup enables you to control feature releases, automatically update their health status, and roll back changes when error spikes occur.
Try applying what you have learned in both new and existing projects to improve reliability and control. You can view the complete tutorial project on GitHub.


OpenTelemetry, without the vendor lock-in: Introducing full observability for Open Source and Self-Hosted Flagsmith customers


.png)
.png)

.png)

.png)


.png)


.webp)