
Monitoring Feature Flag Performance with Flagsmith, Prometheus, and Grafana


Continually building, releasing, and improving features is key to improving the functionality and user experience of applications. However, new releases don’t always go smoothly, and many end up buggy, breaking parts of the application or failing to deliver the intended impact. Without adequate monitoring, these issues can go unnoticed until a dissatisfied user reports them.
This is where feature flagging and monitoring tools come in. While feature flags enable you to safely gate features, releasing them at your convenience and ensuring rollbacks without downtime, monitoring tools help you track feature performance in real-time.
In this tutorial, you will learn how to integrate Flagsmith, a leading feature flag tool, into a demo project. You will also learn how to set up Prometheus and Grafana to collect and visualise metrics associated with your feature flags. Additionally, you will learn how to utilise Flagsmith Feature Health to determine the status of a feature, whether it is healthy or not.
Prerequisites
To follow along with this tutorial, you will need:
- A Flagsmith account.
- A GitHub account.
- Node.js version 18 or above installed.
- Docker installed.
Setting up the demo project
To begin integrating Flagsmith, Prometheus, and Grafana, you will first clone a demo project. Run the following in your terminal:
git clone --branch starter-branch https://github.com/Slimdan20/Banking-app
cd Banking-app
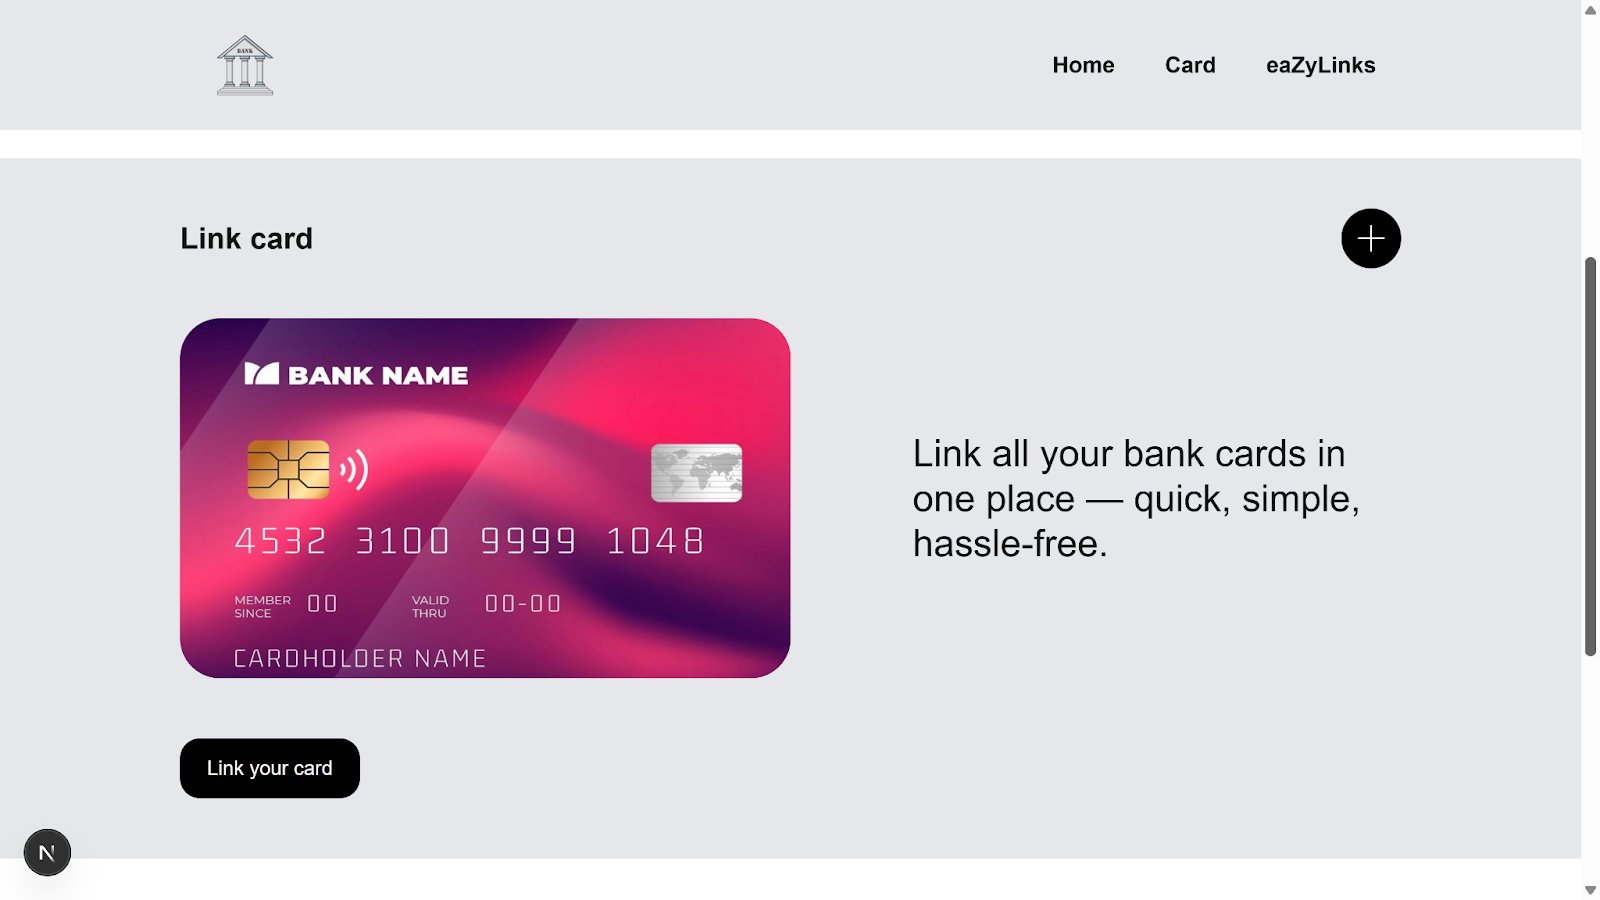
npm installNote: The demo project used in this tutorial is a banking app built with Next.js. It includes a card page that allows users to link their bank cards for easy transactions. This page is currently commented out and will serve as the test feature for integrating Flagsmith for feature flagging, and Prometheus and Grafana for monitoring. You can follow along with this project or use a similar one of your choice.
You can host the demo project on GitHub by following these steps.
Integrating Flagsmith for feature flagging
With your project set up locally, the next step is to configure Flagsmith for feature flagging.
To get started, sign in to your Flagsmith account to access the Flagsmith dashboard.
Next, click on the Create Project button on the dashboard and enter a project name of your choice, such as Flagsmith-demo used in this tutorial.

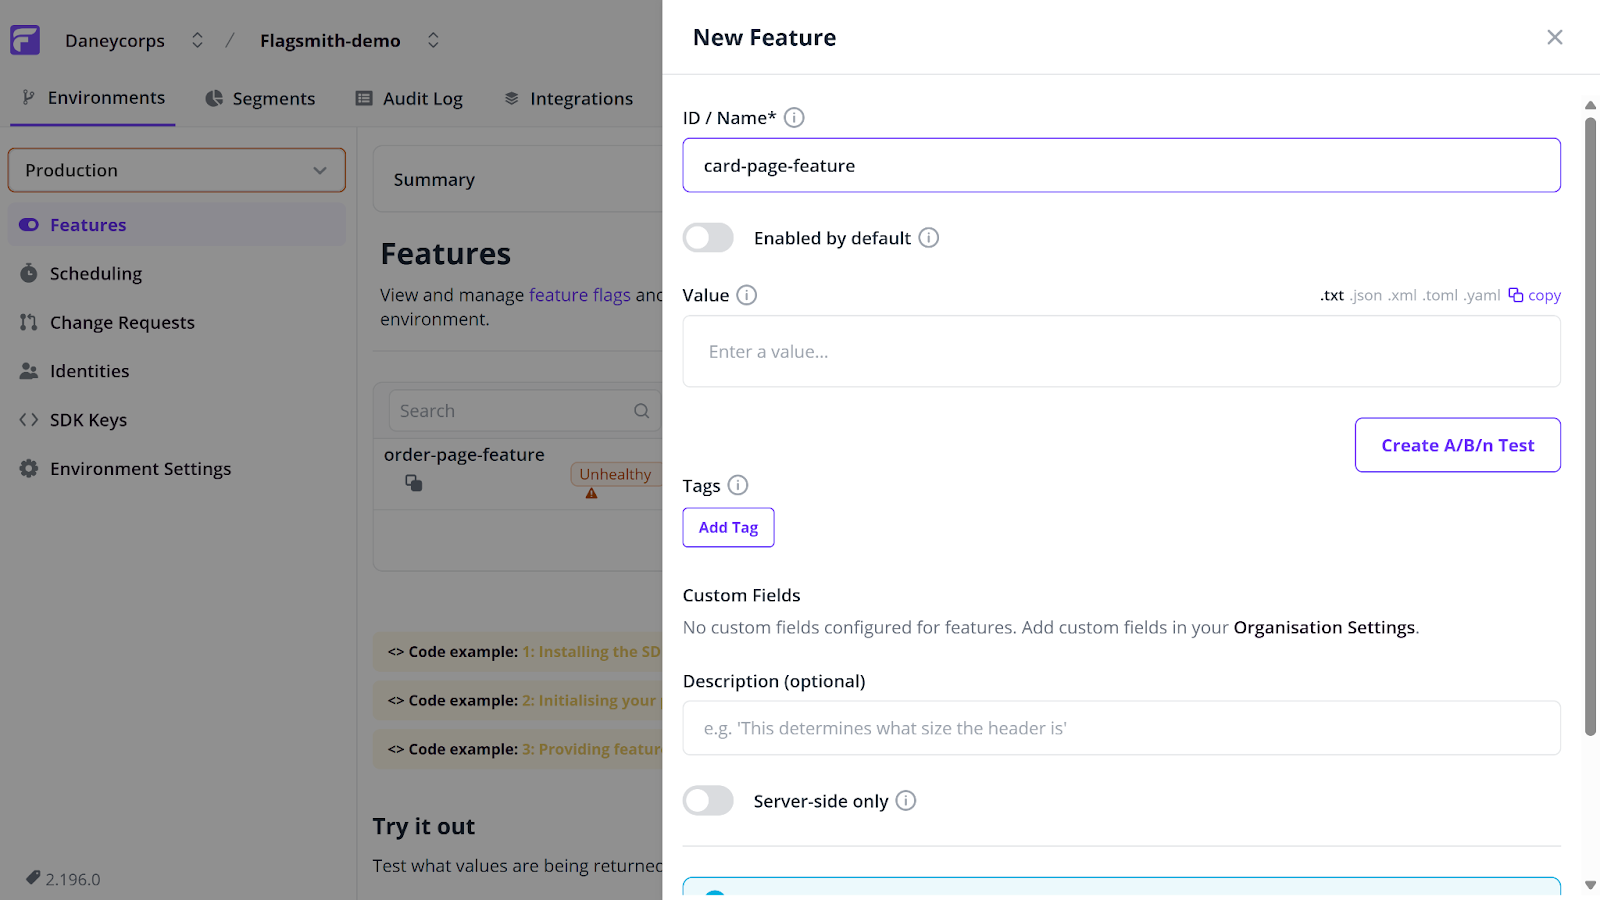
Within your created project dashboard, click the Create Feature button, enter a name for your feature, and click Create Feature to continue.
Navigate to the SDK Keys tab and copy your Client-side Environment Key, as you will need it later in this tutorial.

Head to your project terminal and install the JavaScript client for Flagsmith by running:
npm i flagsmith --saveNext, within your src/app folder, create a Providers folder. Inside the Providers folder, create a FlagsmithWrapper.tsx file and update its content with the following:
"use client";


import { useEffect, useState, ReactNode } from "react";
import { FlagsmithProvider } from "flagsmith/react";
import flagsmith from "flagsmith";


export default function FlagsmithWrapper({ children }: { children: ReactNode }) {
  const [ready, setReady] = useState(false);


  useEffect(() => {
    flagsmith
      .init({
        environmentID: "YOUR_ENVIRONMENT_ID",
      })
      .then(() => setReady(true))
      .catch((err) => {
        console.error("Flagsmith initialization failed:", err);
        setReady(true);
      });
  }, []);


  if (!ready) return null;


  return (
    <FlagsmithProvider flagsmith={flagsmith}>
      {children}
    </FlagsmithProvider>
  );
}
In the code above:
- "use client" ensures the component runs on the client side, allowing React hooks like useState and useEffect to work properly in your Next.js app.
- import { FlagsmithProvider } from "flagsmith/react" and import flagsmith from "flagsmith" bring in the tools your app needs to interact with Flagsmith and make feature flags accessible throughout your components.
- environmentID: "YOUR_ENVIRONMENT_ID" connects your app to the correct Flagsmith project and environment using your unique environment key.
Note: Replace YOUR_ENVIRONMENT_ID with the Client-side Environment Key you copied earlier.
After that, import and wrap your project with Flagsmith. To do this, navigate to src/app/layout.tsx and update its content with the following:
import FlagsmithWrapper from "./Providers/FlagsmithWrapper"; // import the FlagsmithWrapper component created earlier


export default function RootLayout({ children,
}: Readonly<{
  children: React.ReactNode;
}>) {
  return (
    <html lang="en">
      <body>
        <FlagsmithWrapper> {/* Wrap all child components with Flagsmith provider */}
          {children}
        </FlagsmithWrapper>
      </body>
    </html>
  );
}
Note: It is best practice to wrap the content in your layout.tsx file with the FlagsmithWrapper, as this ensures your entire Next.js application has access to Flagsmith.
Finally, go to your src/app/page.tsx file, which contains your previously commented-out Cards component, and update its content as follows:
"use client";
import Navbar from "@/Components/Navbar/Navbar";
import Homepage from "@/Components/Homepage/Homepage";
import Cards from "@/Components/Cards/Cards";
import Finance from "@/Components/Finance/Finance";
import { useFlagsmith } from "flagsmith/react";


export default function Home() {
  const flagsmith = useFlagsmith();


  const showCard: boolean = flagsmith.hasFeature("card-page-feature");


  return (
    <main>
      <Navbar />
      <Homepage />
      {showCard && <Cards />}
      <Finance />
    </main>
  );
}
In this sample code:
- import { useFlagsmith } from "flagsmith/react"; import the useFlagsmith hook, which lets your component access feature flags from Flagsmith.
- const flagsmith = useFlagsmith(); gives your component access to the Flagsmith instance so it can check which features are enabled.
- const showCard: boolean = flagsmith.hasFeature("card-page-feature"); checks whether the card page feature is active or not, and stores the result as true or false.
- {showCard && <Cards />} uses the value from const showCard = flagsmith.hasFeature("card-page-feature"); to conditionally render the Card section: if showCard is true, the <Cards /> component is displayed; if false, it stays hidden.
Finally, run your app in the browser by entering the below command in your terminal:
npm run devAt this point, you will realise your card feature is not yet available. This is because you are yet to toggle it on in your Flagsmith dashboard.
To activate it, go to the Features tab on the Flagsmith dashboard, locate your created feature (in this tutorial, it is the card-page-feature), and toggle it on.

Reload your application in the browser to see the Card page.
There you have it! You can now control when your feature goes live or retract features without risking downtime.
Setting up Prometheus for metrics collection
With Flagsmith configured to safely gate your feature, the next step is monitoring how your gated feature performs in real time.
This is where Prometheus comes in. Prometheus is an open-source monitoring and alerting tool that collects and stores metric data in a time-series database. With these metrics, you can monitor application health, identify potential issues early, and take proactive steps to resolve them before they impact users.
Setting up Prometheus involves two major steps:
- Exposing your app metrics.
- Configuring Prometheus to pick up the exposed metrics.
To get started with integrating Prometheus, you first need to instrument your application to expose the necessary metrics.
Exposing metrics in your application
Note: This tutorial focuses on monitoring three key metrics:
- Feature usage
- Feature adoption
- Errors caused by the feature
First, install the Prometheus client for Node.js by entering the below command in your terminal:
npm install prom-clientNext, in your src/app folder, create an api/metrics folder. Inside this folder, create a route.ts file.
Your folder structure should look like this:
src/
  app/
    api/
      metrics/
        route.ts
Now, update the content of route.ts with the following:
import { NextResponse, NextRequest } from "next/server";
import { Counter, register } from "prom-client";


const featureUsageCounter = new Counter({
  name: "feature_usage_total",
  help: "Total number of times feature flags are evaluated",
});


const featureAdoptionCounter = new Counter({
  name: "feature_adoption_total",
  help: "Total number of users using enabled features",
});


const featureErrorCounter = new Counter({
  name: "feature_errors_total",
  help: "Total number of errors caused by feature flags",
});


type MetricsAction = "usage" | "adoption" | "error";


interface MetricsActionBody {
  action: MetricsAction;
}


export async function GET() {
  return new NextResponse(await register.metrics(), {
    headers: { "Content-Type": register.contentType },
  });
}


export async function POST(req: NextRequest) {
  try {
    const { action }: MetricsActionBody = await req.json();


    switch (action) {
      case "usage":
        (featureUsageCounter as any).inc();
        break;
      case "adoption":
        (featureAdoptionCounter as any).inc();
        break;
      case "error":
        (featureErrorCounter as any).inc();
        break;
      default:
        return NextResponse.json(
          { success: false, error: "Invalid action" },
          { status: 400 }
        );
    }


    return NextResponse.json({ success: true });
  } catch (err: unknown) {
    const errorMessage = err instanceof Error ? err.message : "Unknown error occurred";
    return NextResponse.json({ success: false, error: errorMessage }, { status: 500 });
  }
}
In the code above:
- import { NextResponse, NextRequest } from 'next/server'; imports the tools required to send HTTP responses from your Next.js API route.
- import { Counter, register } from 'prom-client'; imports Prometheus tools required to define counters and keep track of metrics.
- const featureUsageCounter = new Counter({...}) counts the number of times your feature evaluation event is recorded.
- const featureAdoptionCounter = new Counter({...}) counts how many users interact with your feature that is turned on.
- const featureErrorCounter = new Counter({...}) counts errors caused by feature flags.
- export async function GET() sends current metric values to Prometheus in a format it understands, so it can scrape them.
- export async function POST(req:NextRequest) increases the right counter (usage, adoption, or error) depending on the action sent in the request.
Next, go to your src/components/Cards/Cards.tsx file and update its content:
"use client";
const Cards = () => {
  useEffect(() => {
    fetch("/api/metrics", {
      method: "POST",
      body: JSON.stringify({ action: "usage" }),
      headers: { "Content-Type": "application/json" },
    });
  }, []);


  const handleOrderClick = async (): Promise<void> => {
    try {
      await fetch("/api/metrics", {
        method: "POST",
        body: JSON.stringify({ action: "adoption" }),
        headers: { "Content-Type": "application/json" },
      });
    } catch (err: unknown) {
      console.error("Error during order click:", err);
      await fetch("/api/metrics", {
        method: "POST",
        body: JSON.stringify({ action: "error" }),
        headers: { "Content-Type": "application/json" },
      });
    }
  };
  return (
    <button onClick={handleOrderClick}>Link your card</button>
  )
}
export default Cards
In file above:
- useEffect(() => {...}, []) tracks the usage of your feature flag when the component first loads. It does this by sending a POST request to /api/metrics with the action set to "usage", recording that the feature was evaluated.
- const handleOrderClick = async ():Promise<void> => {...} tracks feature adoption when users click the "Link your card" button. It does this by sending a POST request to /api/metrics with the action set to "adoption". If an error occurs, it instead sends a request with the action set to "error", recording the failure.
- <button onClick={handleOrderClick}>Link your card</button> renders a button that calls the handleOrderClick function. This triggers feature adoption or error tracking when clicked.
Finally, start your development server by running:
npm run devThis will provide you with a local URL. Press the CTRL key and click the URL (e.g., http://localhost:3000/) to open your app in the browser.
To check if your application is exposing the necessary metrics, visit http://localhost:3000/api/metrics.
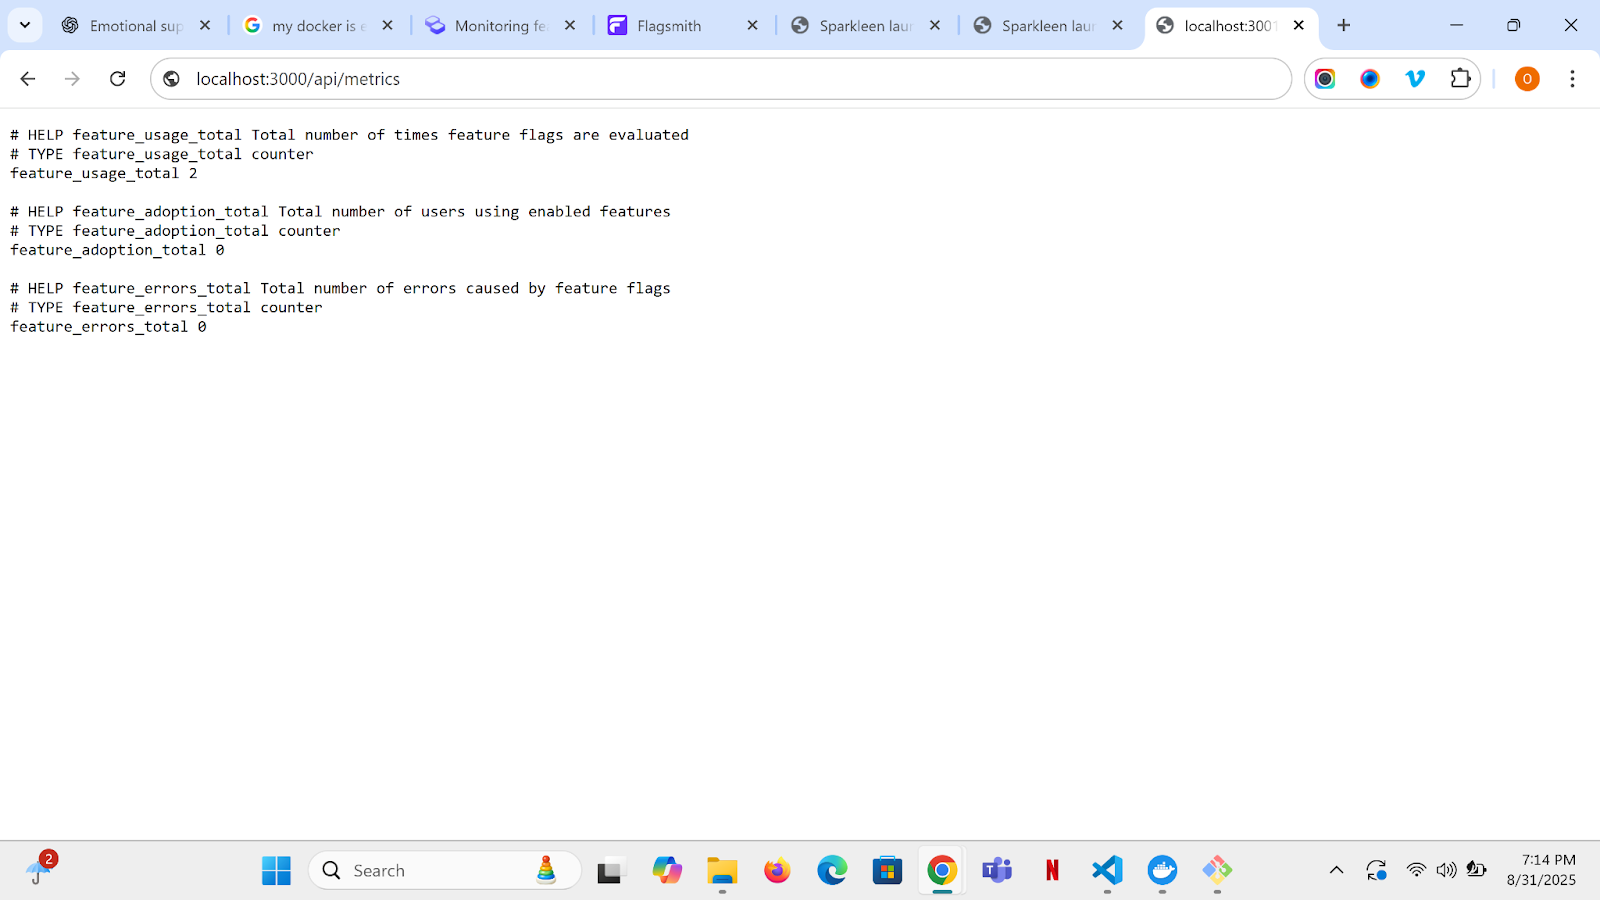
Note: If port 3000 is unavailable, Next.js may open your app on a different port. In that case, replace 3000 in the URL above with the provided port to view your exposed metrics.
Collecting metrics in the Prometheus dashboard
Upon exposing your metrics, the next step is to configure Prometheus to collect and display them in its dashboard.
This involves three main steps:
- Creating a Dockerfile.
- Creating a prometheus.yml file.
- Creating a docker-compose file.
We will go through each of these in turn.
To get started, create a Dockerfile at the root of your project and update its content with the following:
FROM node:20-alpine AS builder
WORKDIR /app
COPY package*.json ./
RUN npm install
COPY . .
RUN npm run build


FROM node:20-alpine AS runner
WORKDIR /app
ENV NODE_ENV=production


COPY --from=builder /app/.next/standalone ./
COPY --from=builder /app/.next/static ./.next/static
COPY --from=builder /app/public ./public


CMD ["node", "server.js"]
The above configuration shows a Dockerfile that builds and runs your Next.js application in a lightweight production environment.
The file uses a two-stage setup. In the first stage, called the Builder stage, FROM node:20-alpine AS builder copies the project files using COPY package*.json ./, installs the necessary dependencies with RUN npm install, and finally generates a production-ready build using npm run build.
In the second stage, known as the Runner stage, FROM node:20-alpine AS runner copies the required build artifacts from the builder using COPY --from=builder /app/.next/standalone ./, COPY --from=builder /app/.next/static ./.next/static, and COPY --from=builder /app/public ./public. The line ENV NODE_ENV=production sets the environment to production, and the application is started with CMD ["node", "server.js"].
Next, create a .dockerignore file at the root of your project:
.next
node_modules
.git
.gitignore
.vscode/
npm-debug.log*
*.log
Navigate to next.config.mjs and add the following:
/** @type {import('next').NextConfig} */
const nextConfig = {
  output: 'standalone',
};
export default nextConfig;
At the root of your project, create a prometheus.yml file and update it as follows:
global:
  scrape_interval: 15s
scrape_configs:
  - job_name: "flagsmith-app"
    metrics_path: /api/metrics
    static_configs:
      - targets: ["host.docker.internal:3000"]
The above configuration illustrates how metrics are collected from your Next.js app.
The line global: scrape_interval: 15s configures Prometheus to collect metrics every 15 seconds. Under scrape_configs:, the job is named flagsmith-app and Prometheus is instructed to fetch metrics from the /api/metrics endpoint. Finally, static_configs: - targets: ["host.docker.internal:3000"] points Prometheus to the Next.js server running locally inside your Docker setup.
Note: host.docker.internal works for Windows and MacOS. If you are using Linux, you need to adjust the target accordingly.
Finally, create a docker-compose.yml file at the root of your project:
services:
  flagsmith:
    build: .
    container_name: flagsmith
    ports:
      - "3000:3000"
    networks:
      - monitoring


  prometheus:
    image: prom/prometheus:v2.52.0
    container_name: prometheus
    ports:
      - "9090:9090"
    volumes:
      - ./prometheus.yml:/etc/prometheus/prometheus.yml
    networks:
      - monitoring


networks:
  monitoring:
The above configuration defines a docker-compose.yml file that runs both your Next.js app and Prometheus together in a shared environment.
Two services are defined. The Flagsmith service builds your Next.js app with build: ., names the container flagsmith, and maps it to port 3000 using ports: - "3000:3000".
The second service, Prometheus, runs with the official image prom/prometheus:v2.52.0. It names the container prometheus and exposes the dashboard on port 9090 using ports: - "9090:9090". The line volumes: - ./prometheus.yml:/etc/prometheus/prometheus.yml mounts your Prometheus configuration file so it knows where to scrape metrics from.
Finally, networks: monitoring: defines a user-defined bridge network so that Flagsmith and Prometheus can communicate with each other.
With your Dockerfile, prometheus.yml, and docker-compose.yml files configured, build and run your containers with:
docker-compose up -d --buildThis command builds your Docker images and starts the necessary containers in the background. Your application will be available at http://localhost:3000/, and Prometheus will be available at http://localhost:9090/.
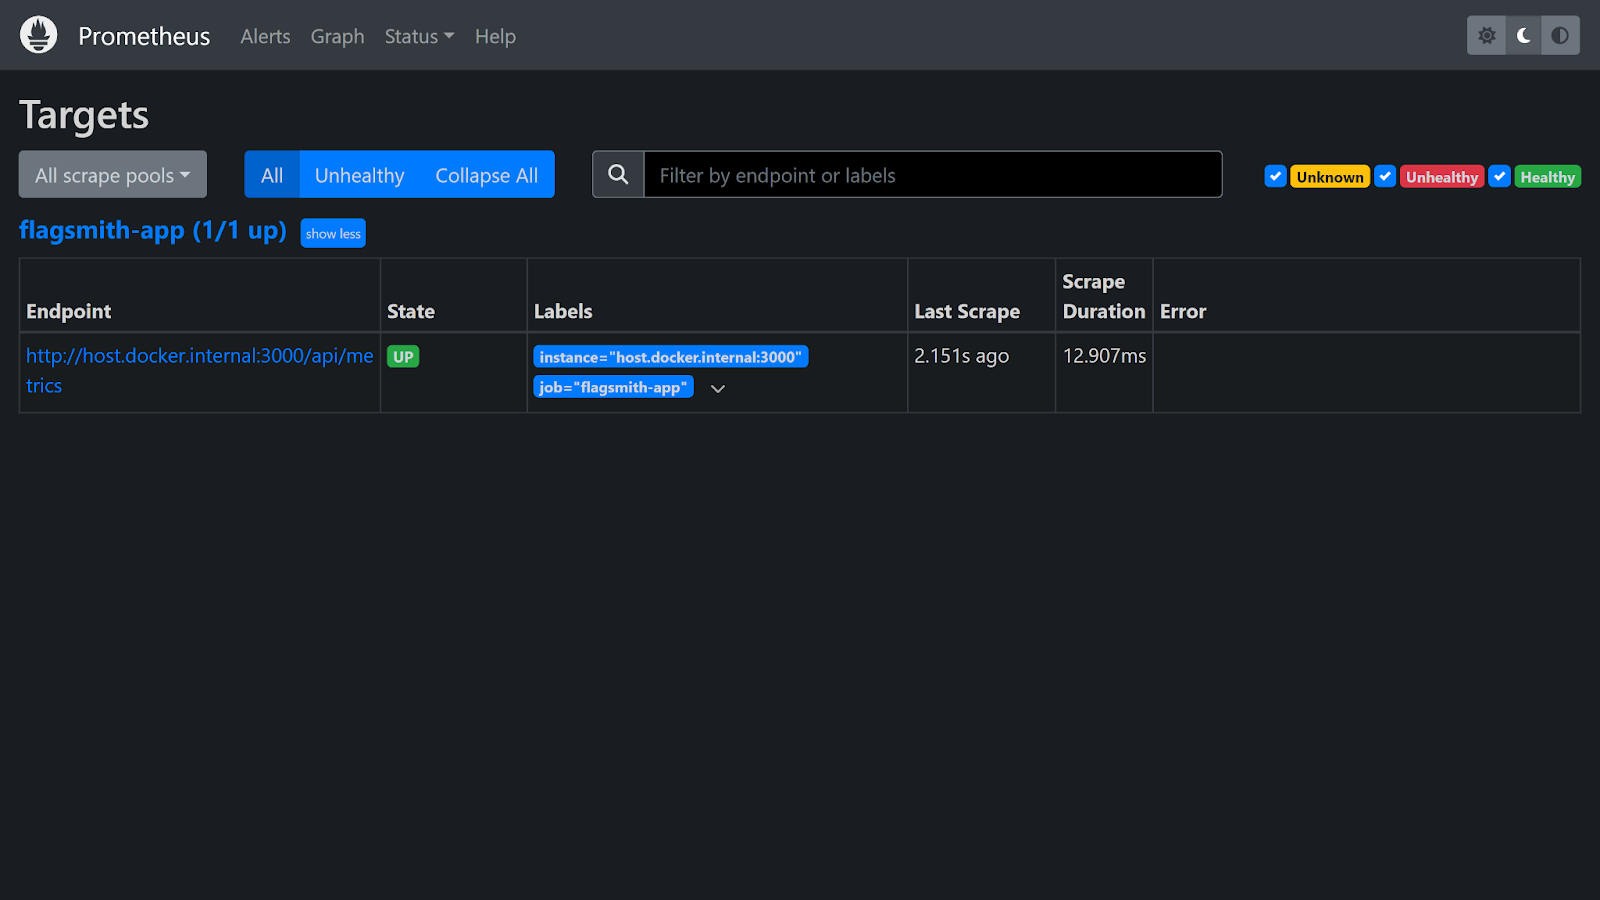
To confirm if Prometheus is correctly scraping your app metrics, open the Prometheus dashboard at http://localhost:9090, navigate to Status → Targets. Your app should display UP under the State column.
Visualising metrics in Grafana
With Prometheus configured to scrape and store your app metrics, you can take your workflow a step further by integrating an observability tool. A perfect choice for this is Grafana.
Grafana is an open-source visualisation tool that allows users to monitor the performance of applications in real-time. With Grafana, you can create customisable dashboards and query data from several monitoring tools, such as Prometheus, to see how your application is performing.
To set up Grafana in your project, update your docker-compose.yml file by adding the following:
 grafana:
    image: grafana/grafana:10.4.2
    container_name: grafana
    ports:
      - "3001:3000"
    volumes:
      - grafana-data:/var/lib/grafana
    depends_on:
      - prometheus
    networks:
      - monitoring
    restart: unless-stopped
    environment:
      - GF_SECURITY_ADMIN_PASSWORD=admin


volumes:
  grafana-data: {}
The above configuration adds Grafana to your Docker setup.
The grafana service uses the official grafana/grafana:10.4.2 image. It names the container grafana and maps port 3001 on your machine to Grafana’s default port 3000 using ports: - "3001:3000". The line volumes: - grafana-data:/var/lib/grafana creates a persistent storage volume so your dashboards and settings are preserved even if the container restarts.
Finally, the environment variable GF_SECURITY_ADMIN_PASSWORD=admin sets the default password for logging into Grafana.
Restart Docker with:
docker-compose up -dThis command pulls the Grafana image from Docker Hub if it is not already available locally, and then starts the Grafana container along with any related containers in the background. your:
- Application will start at http://localhost:3000/
- Prometheus will start at http://localhost:9090/
- Grafana will start at http://localhost:3001/
So, visit http://localhost:3001/ to access your Grafana dashboard.
To access the dashboard, login in with the following credentials:
- Username: admin
- Password: admin

Next, connect Grafana to Prometheus. To do this, click on the Menu icon → Connections → Add new connection → Data sources.
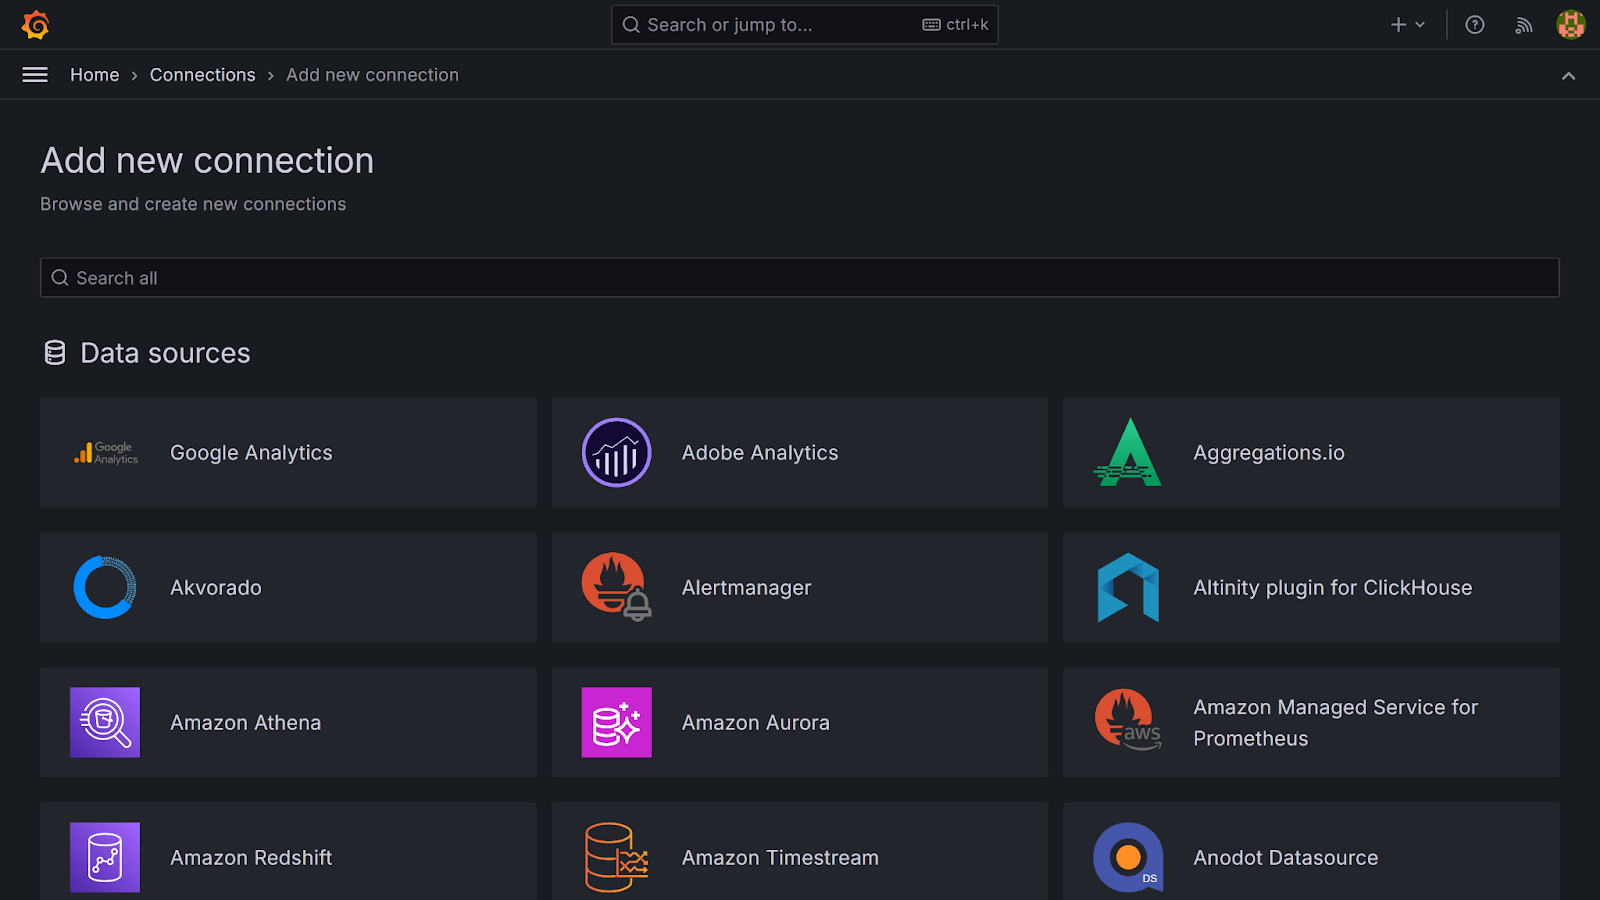
Select Prometheus, then click Add new data source to continue.
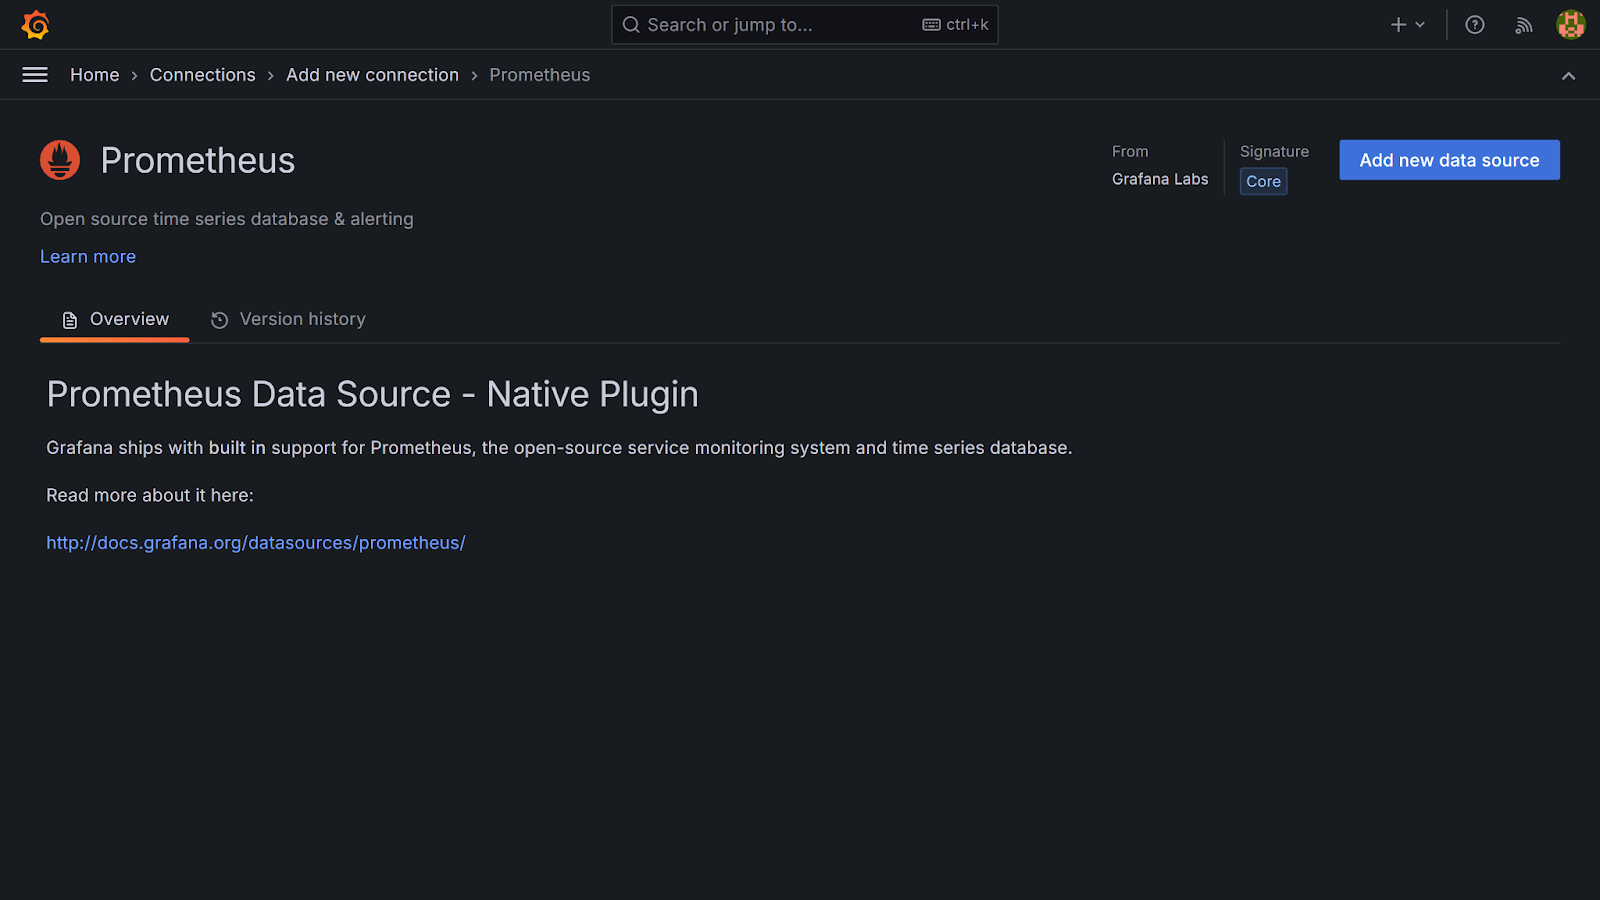
On the Prometheus configuration page, input your Prometheus server URL (http://prometheus:9090), and click Save and test to continue.
You will see a confirmation message stating that Grafana successfully queried the Prometheus API.
Creating a custom dashboard in Grafana
To visualise your stored Prometheus metrics, you need to create a custom Grafana dashboard.
To get started, navigate to the Menu icon → Dashboards, then click Create Dashboard → Add Visualization.

Next, select your data source (in this tutorial, Prometheus). This will open up a Grafana panel.
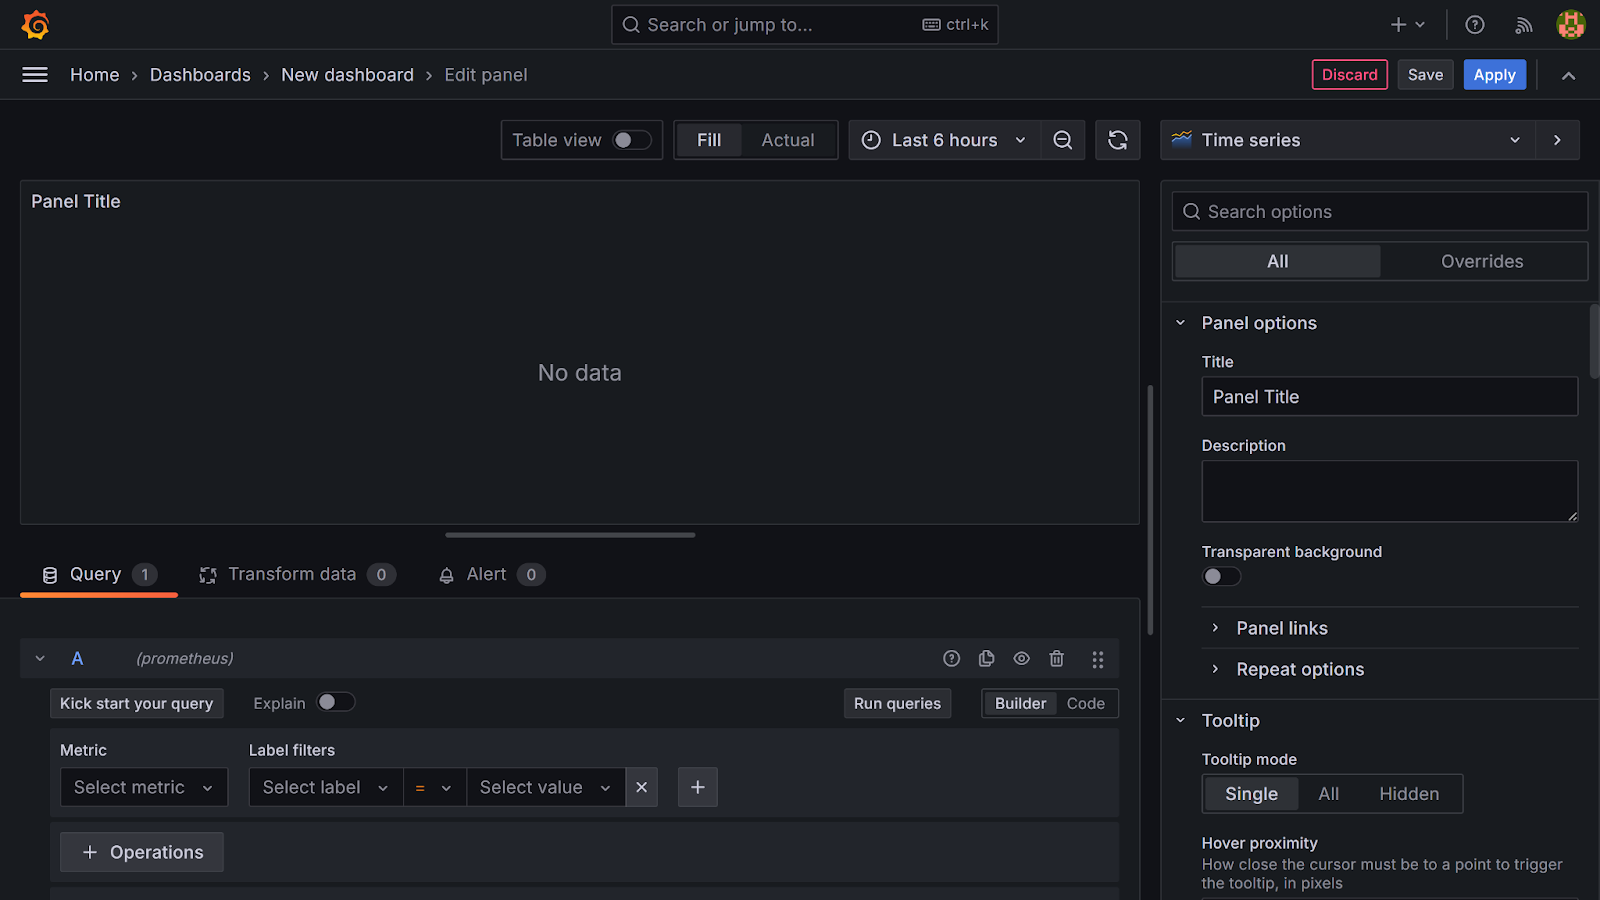
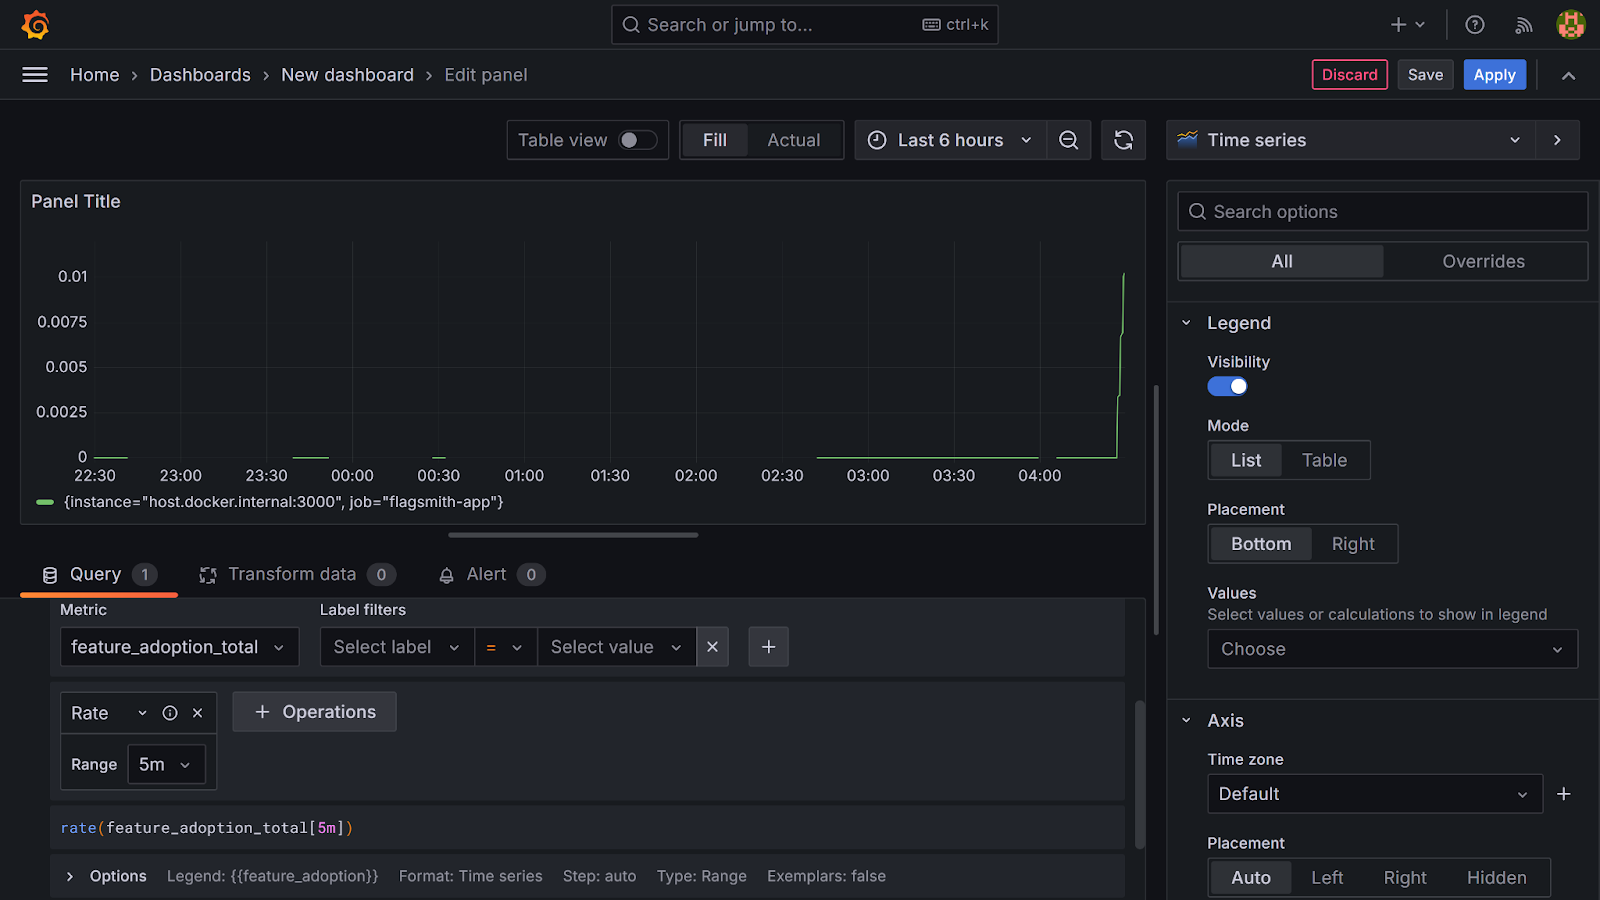
In the Metrics section of your panel, select your first metric (feature_adoption_total). Click the Operations button, search for rate, and select Range functions → Rate to continue.

Next, set the range to 5 minutes. Under Options → Legend → Custom, enter a descriptive name (this tutorial uses feature adoption for feature_adoption_total).
Click Run queries to visualise your metric.
Moving on, click the Add query button, and repeat these steps for feature_usage_total and feature_errors_total to visualise all three metrics.
Finally, click Apply to save changes to the panel.
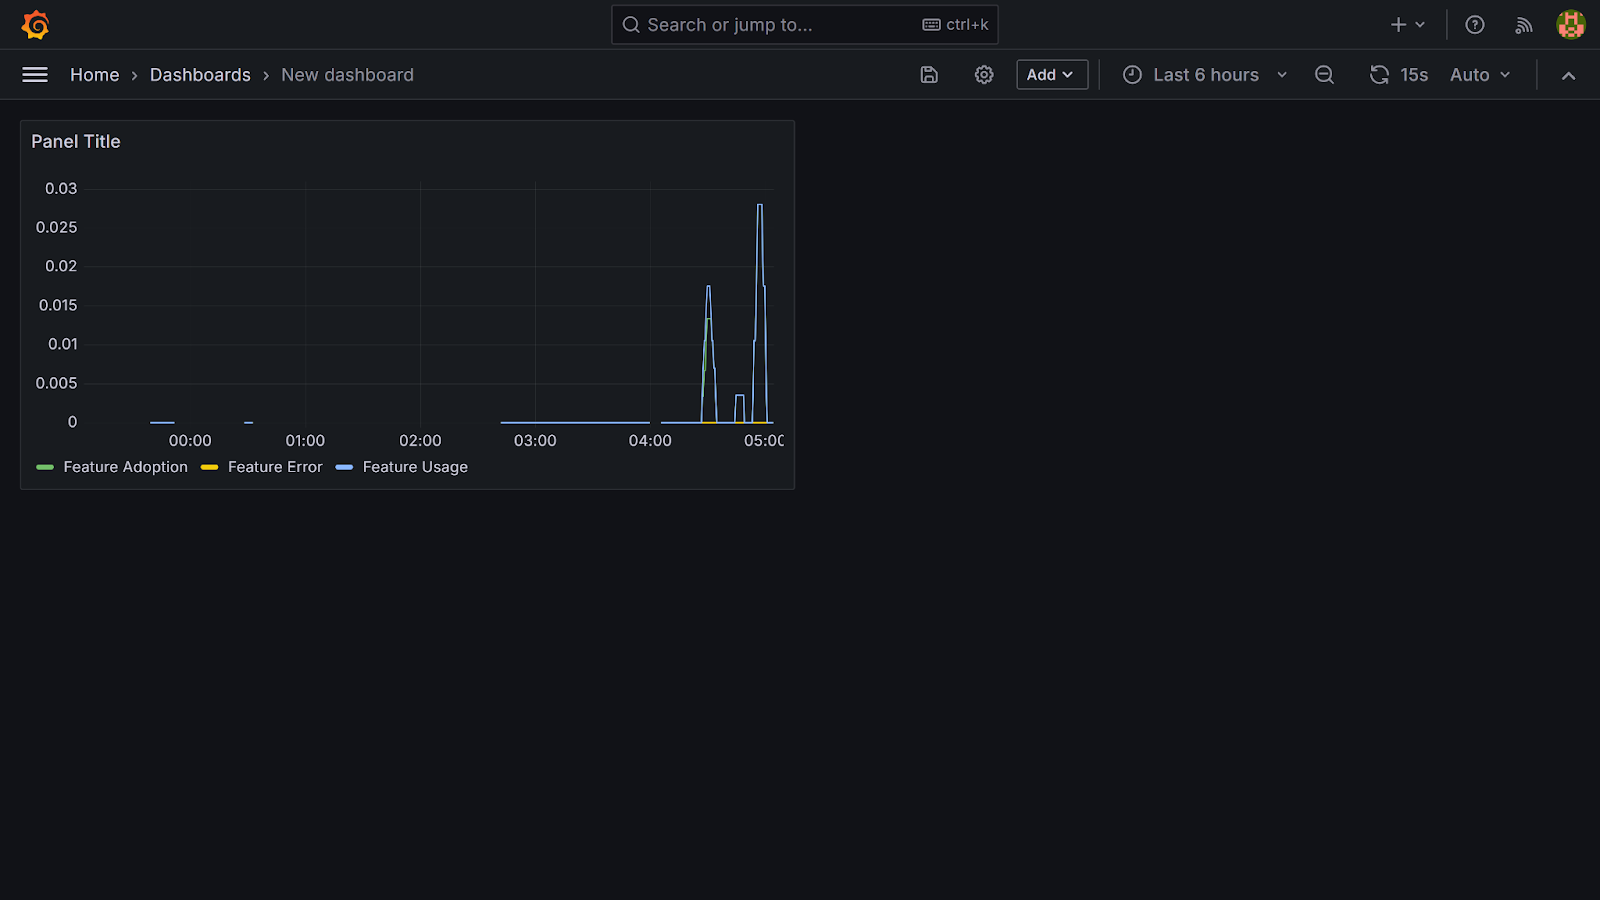
Note: For Grafana to display meaningful metrics, the Card page of your application must be interacted with. In this tutorial, these interactions were performed manually to generate data.
Integrating Grafana with Flagsmith Feature Health
Beyond exposing metrics with Prometheus and visualising them in Grafana, you can also track how individual features are performing directly within Flagsmith using Feature Health.
Feature Health is a Flagsmith feature that integrates with observability tools like Prometheus or Grafana to display the status of a feature as either Healthy or Unhealthy, based on alert notifications. With Feature Health, developers gain immediate insight as to which features are problematic, helping them resolve these issues faster.
To integrate Flagsmith's Feature Health into your workflow, sign in to your Flagsmith account.
Next, navigate to Project settings → Feature Health. Select Grafana as your Provider Name and click the Create button to continue.
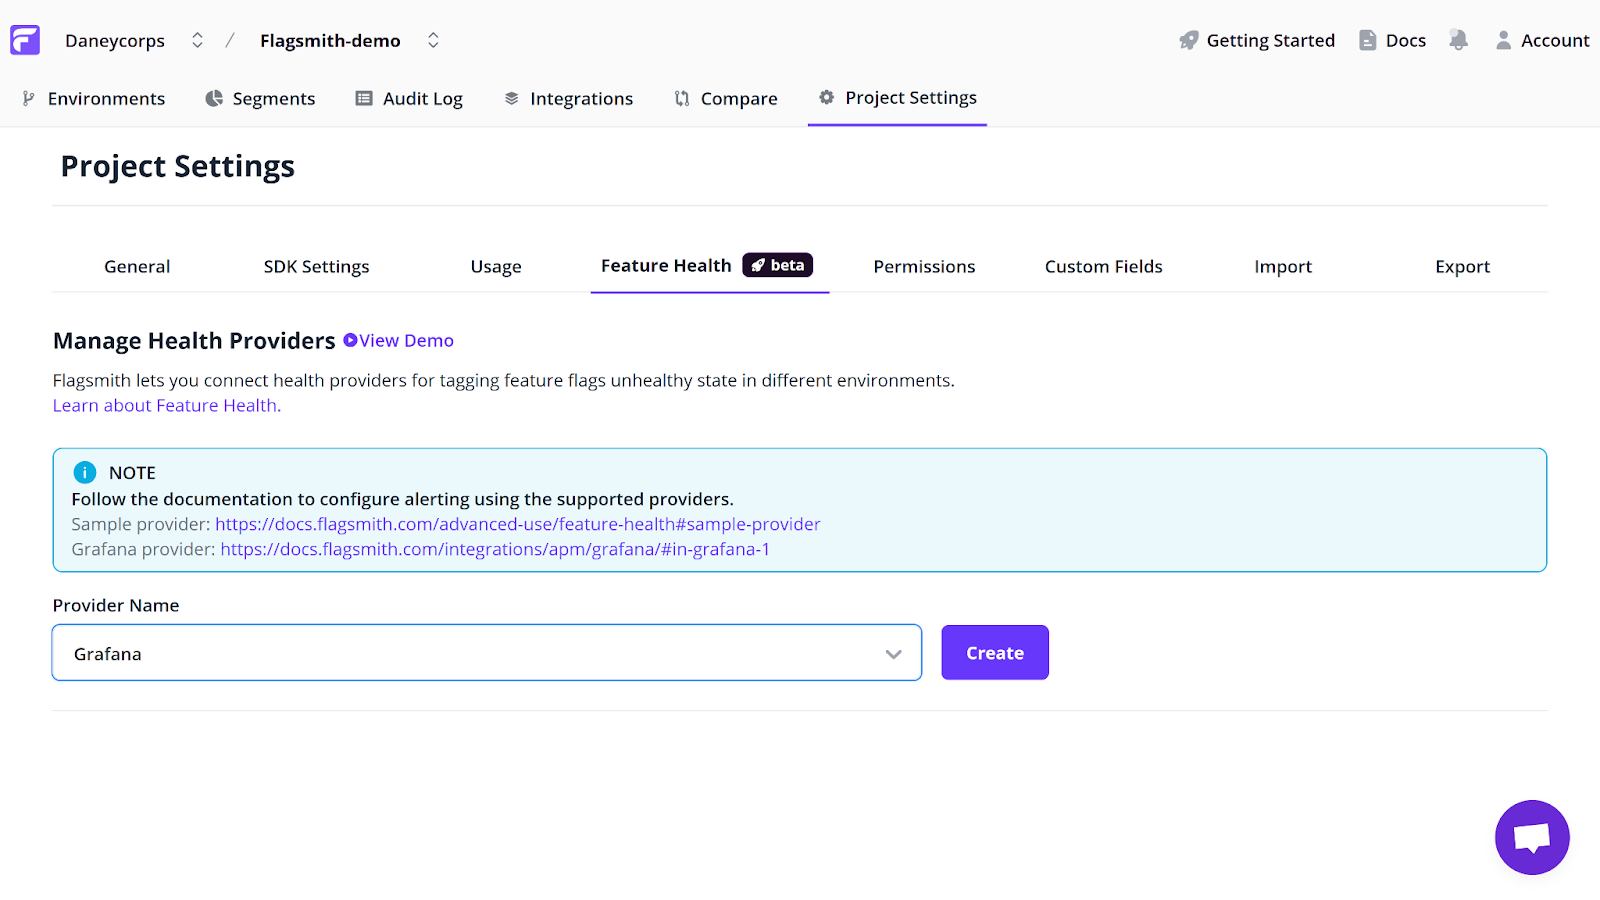
You will be provided with a webhook URL. Copy the provided URL and go to your Grafana dashboard at http://localhost:3001/.
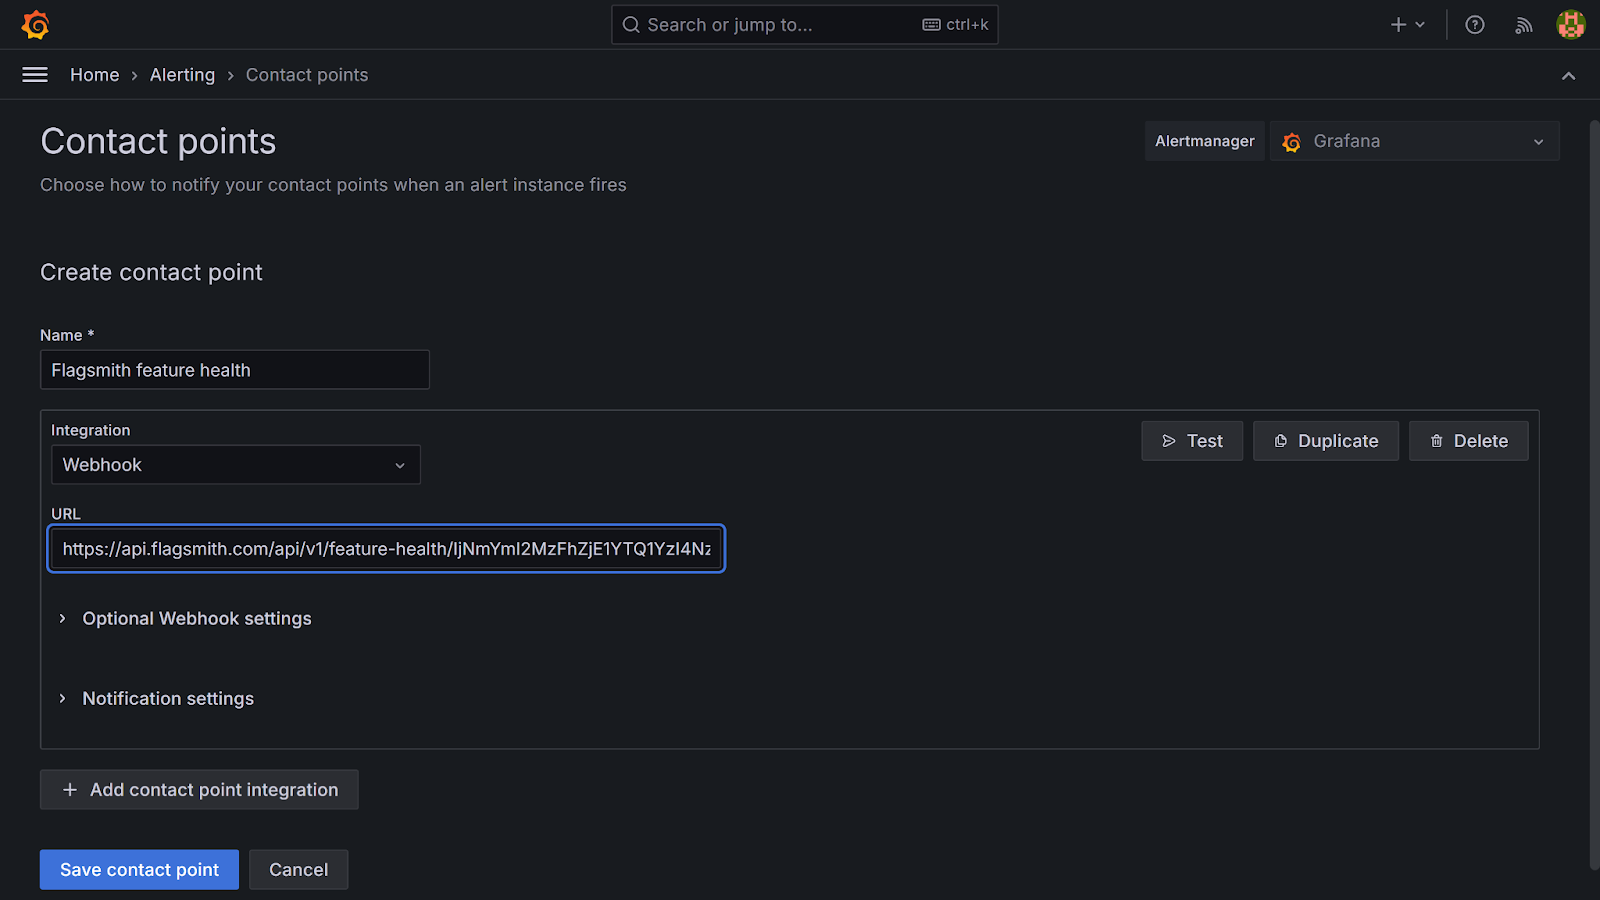
Within your Grafana dashboard, click on the menu icon → Alerting → Contact points → Add contact point.
Then, fill in the fields as follows:
- Contact point name: This tutorial uses Flagsmith feature health.
- Integration: Webhook.
- URL: paste the copied Flagsmith webhook URL.
Click Save contact point to continue.
Next, go to Menu → Alerting → Alert rules → New alert rule.

Give your rule a name. This tutorial uses Feature Adoption Alert as its rule name.
Head to the Define query and alert conditions section. Under Metrics, select the first metric (feature_adoption_total). Click on Operations, search for rate, and choose Range functions → Rate. Then, set the range to 5 minutes. This configuration checks the rate of feature adoption every 5 minutes.
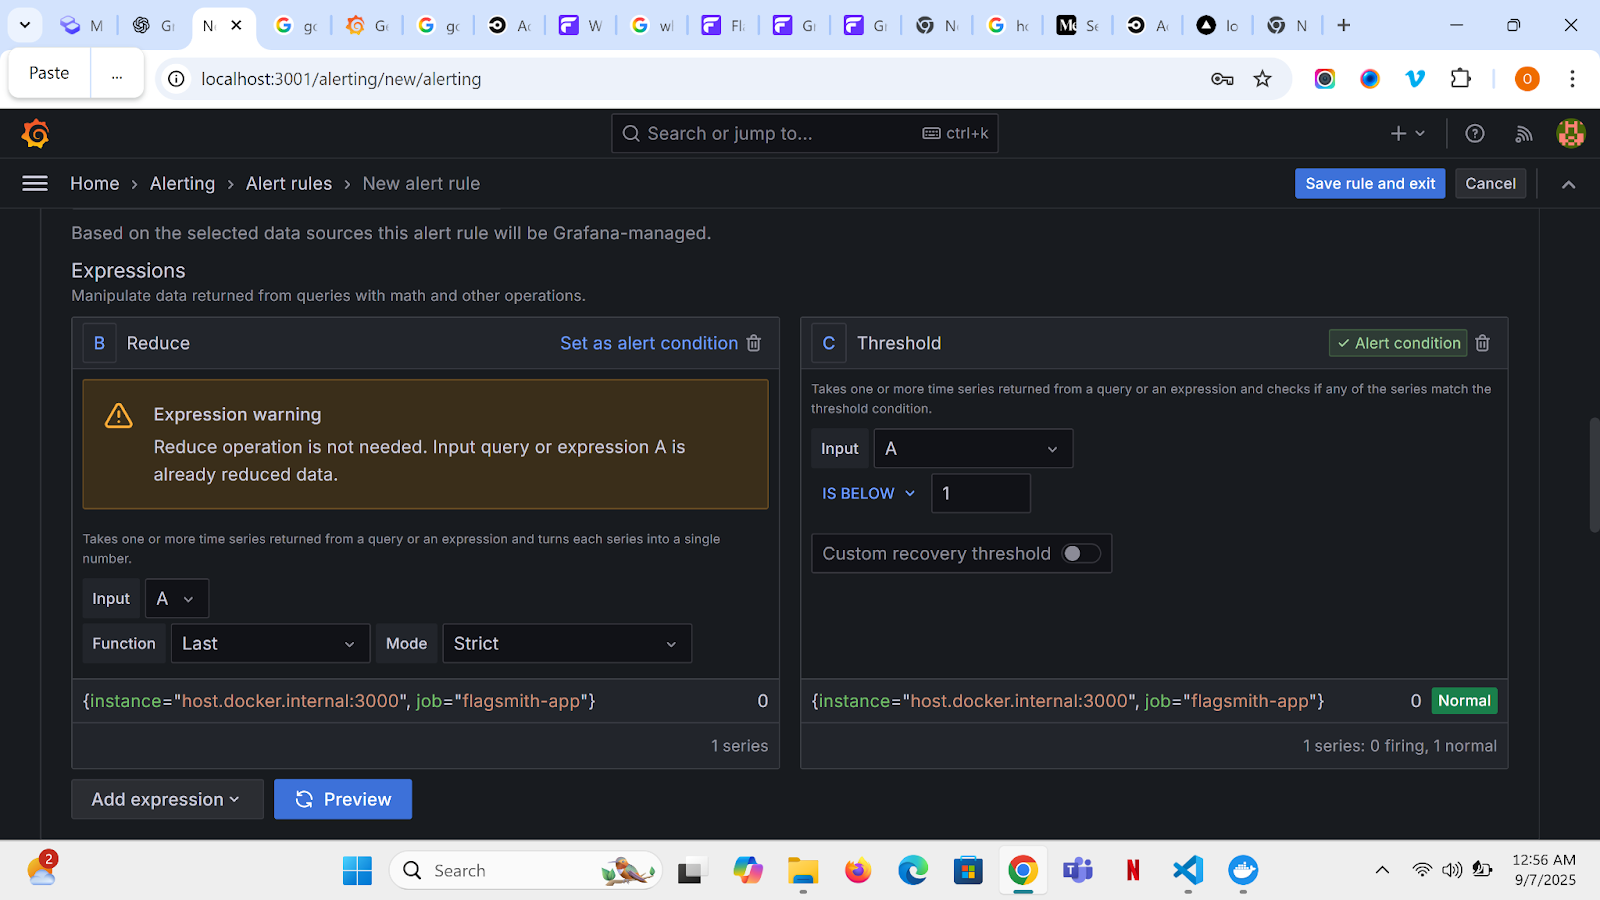
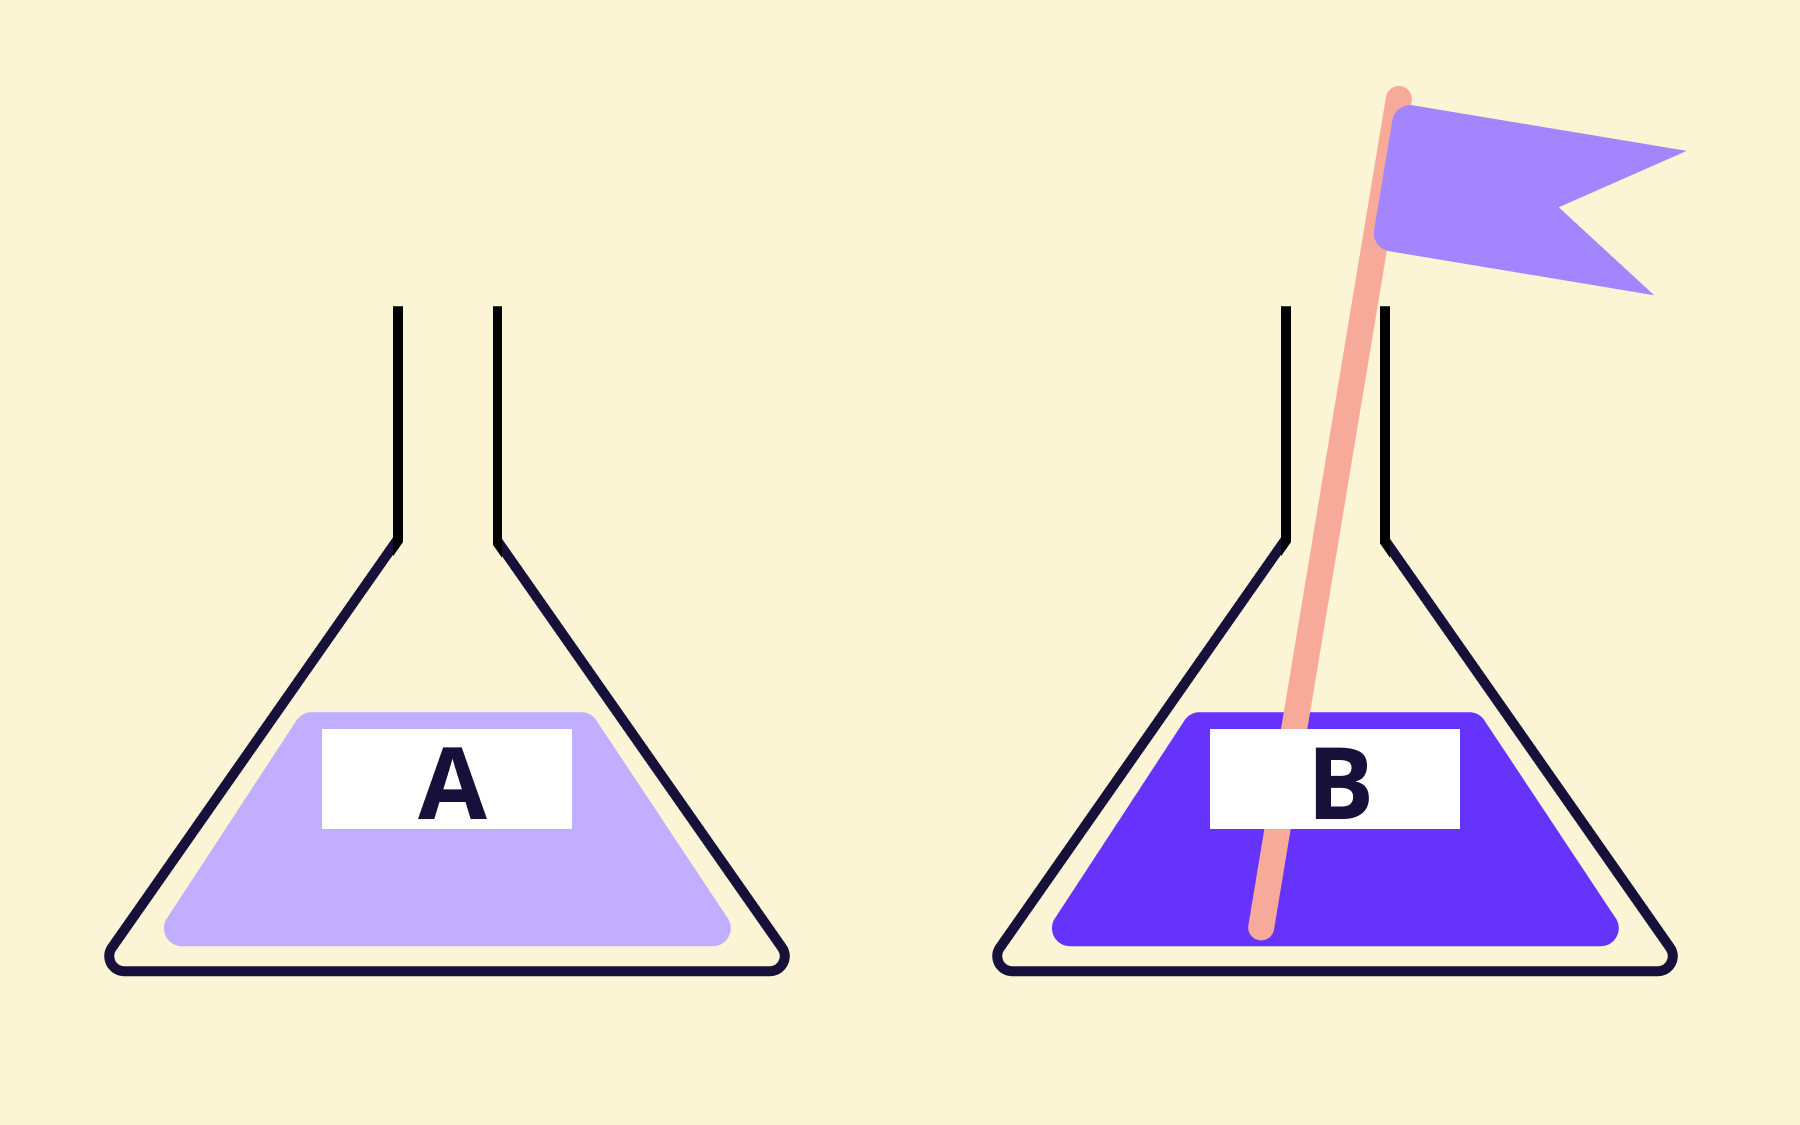
Moving on to the Expressions section, you will see two expressions: Reduce and Threshold. Since your query already returns a single value per series, leave the Reduce step as it is.
For the Threshold step, switch the input field from B to A, and set the condition to is below 1. This means an alert will be triggered whenever the feature_adoption_total rate drops below 1.
In the Set evaluation behaviour section, click the New folder button and name it Alert. Then, click the New evaluation group button, name it Evaluate.
Set the Evaluation interval to 10s, and the Pending period to 3 minutes.
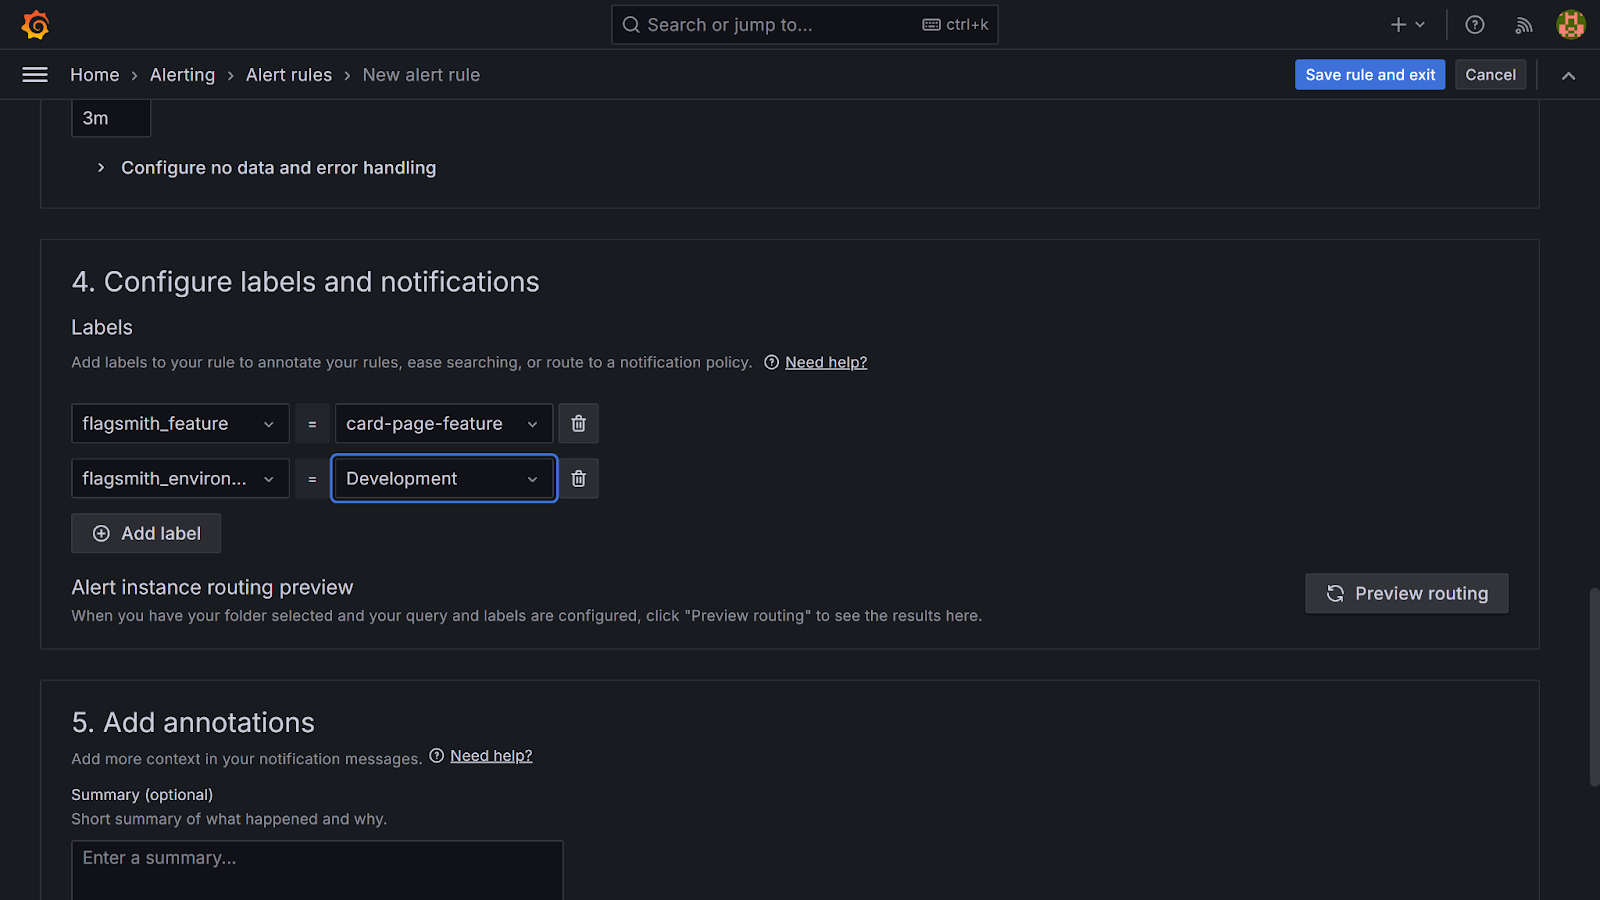
In the Configure labels and notifications section, add the following labels. These labels are special because Flagsmith uses them to link alerts to the correct feature flag and environment:
- Key: flagsmith_feature.
- Value: card-page-feature (name of feature flag used in this tutorial).
Click on Add label, then add another with:
- Key: flagsmith_environment.
- Value: Development.
Finally, click on the Save rule and exit button.
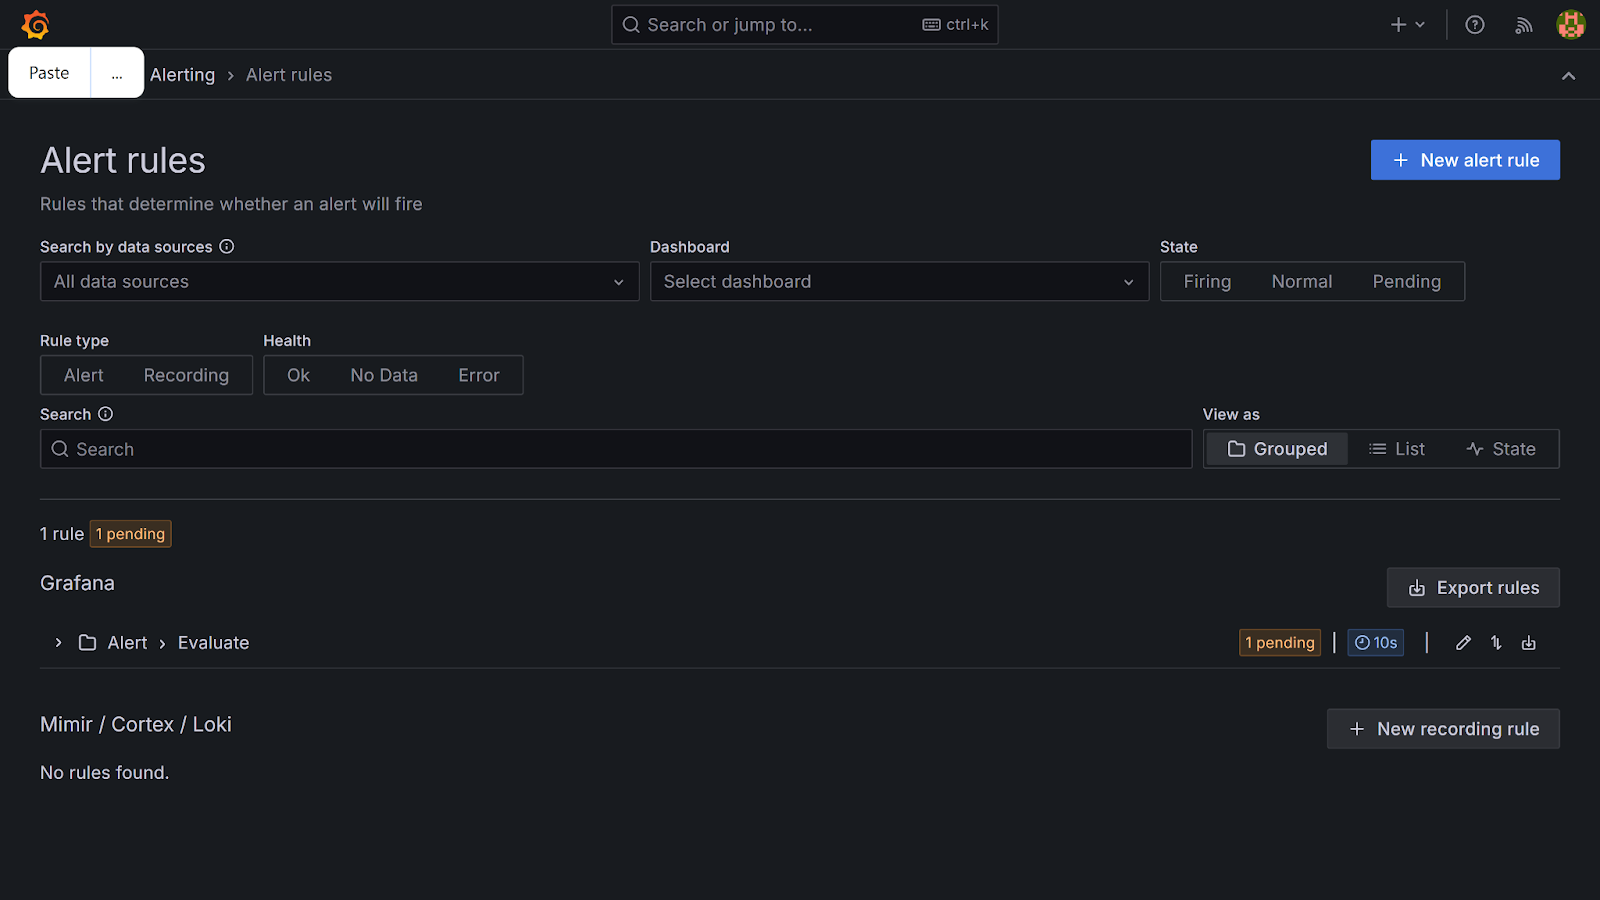
Create new alert rules for feature_usage_total and feature_errors_total following the same steps used in the Feature Adoption Alert.
Note: While setting the alert rule for feature_errors_total, in the Threshold step, set the condition to IS ABOVE with a value of 0. This ensures alerts are sent whenever errors occur.
To complete the setup, go to the menu icon → Alerting → Notification policies → Edit.
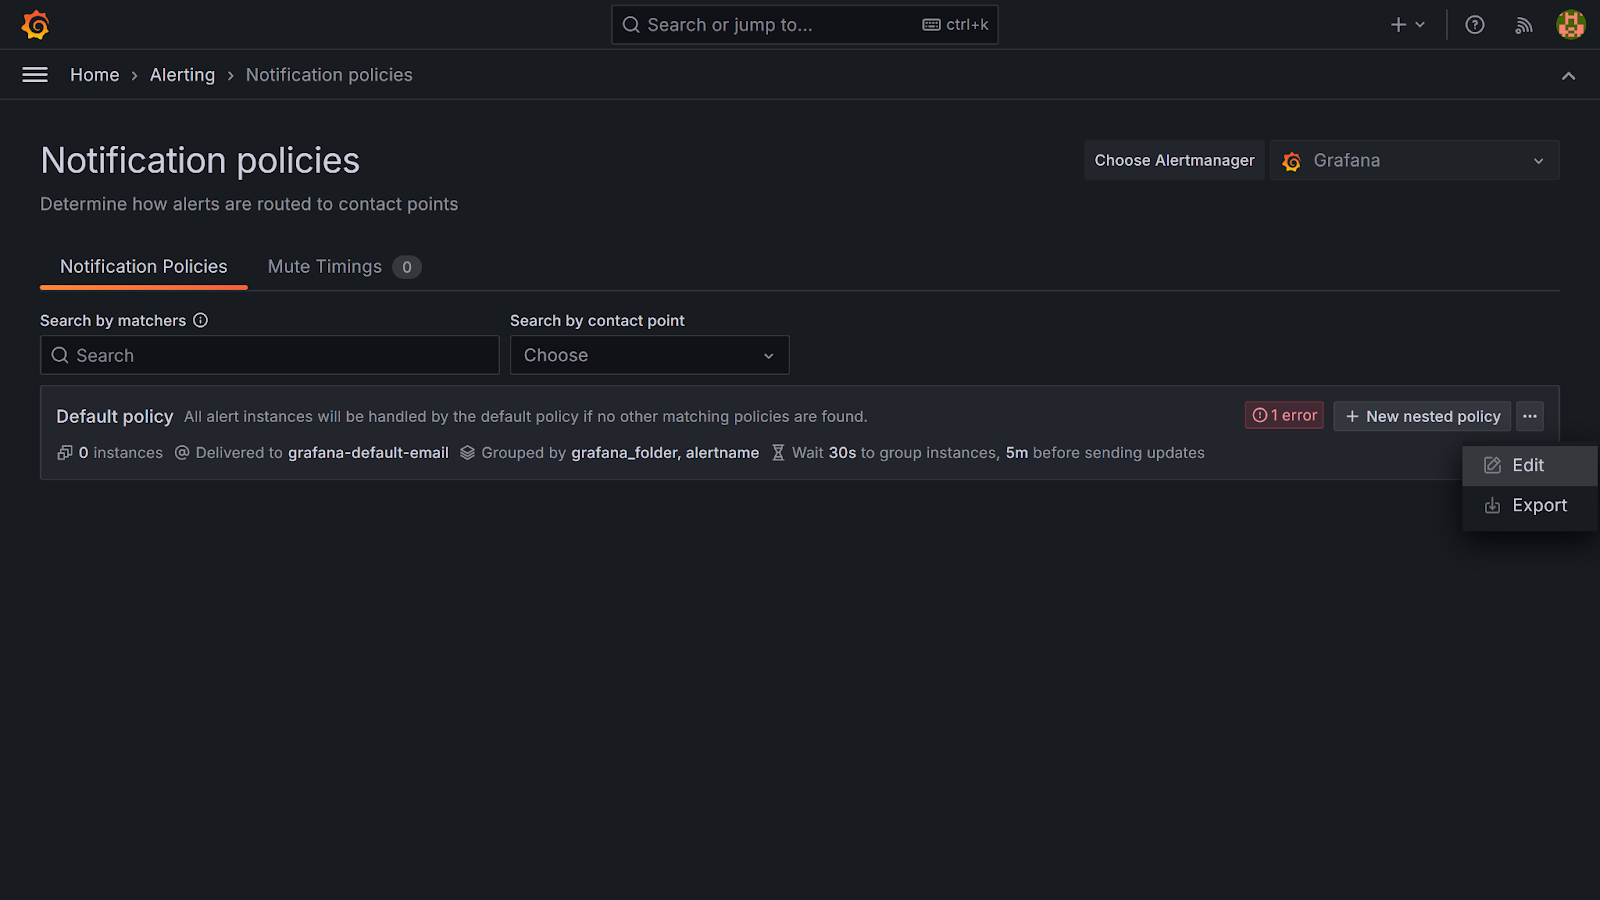
In the Edit notification policy page, go to Default contact point, select your created contact point (in this tutorial, it is Flagsmith feature health) and click Update default policy to finish up.

There you have it! Grafana now sends alerts to Flagsmith, allowing you to view the health of your feature flag in real time.
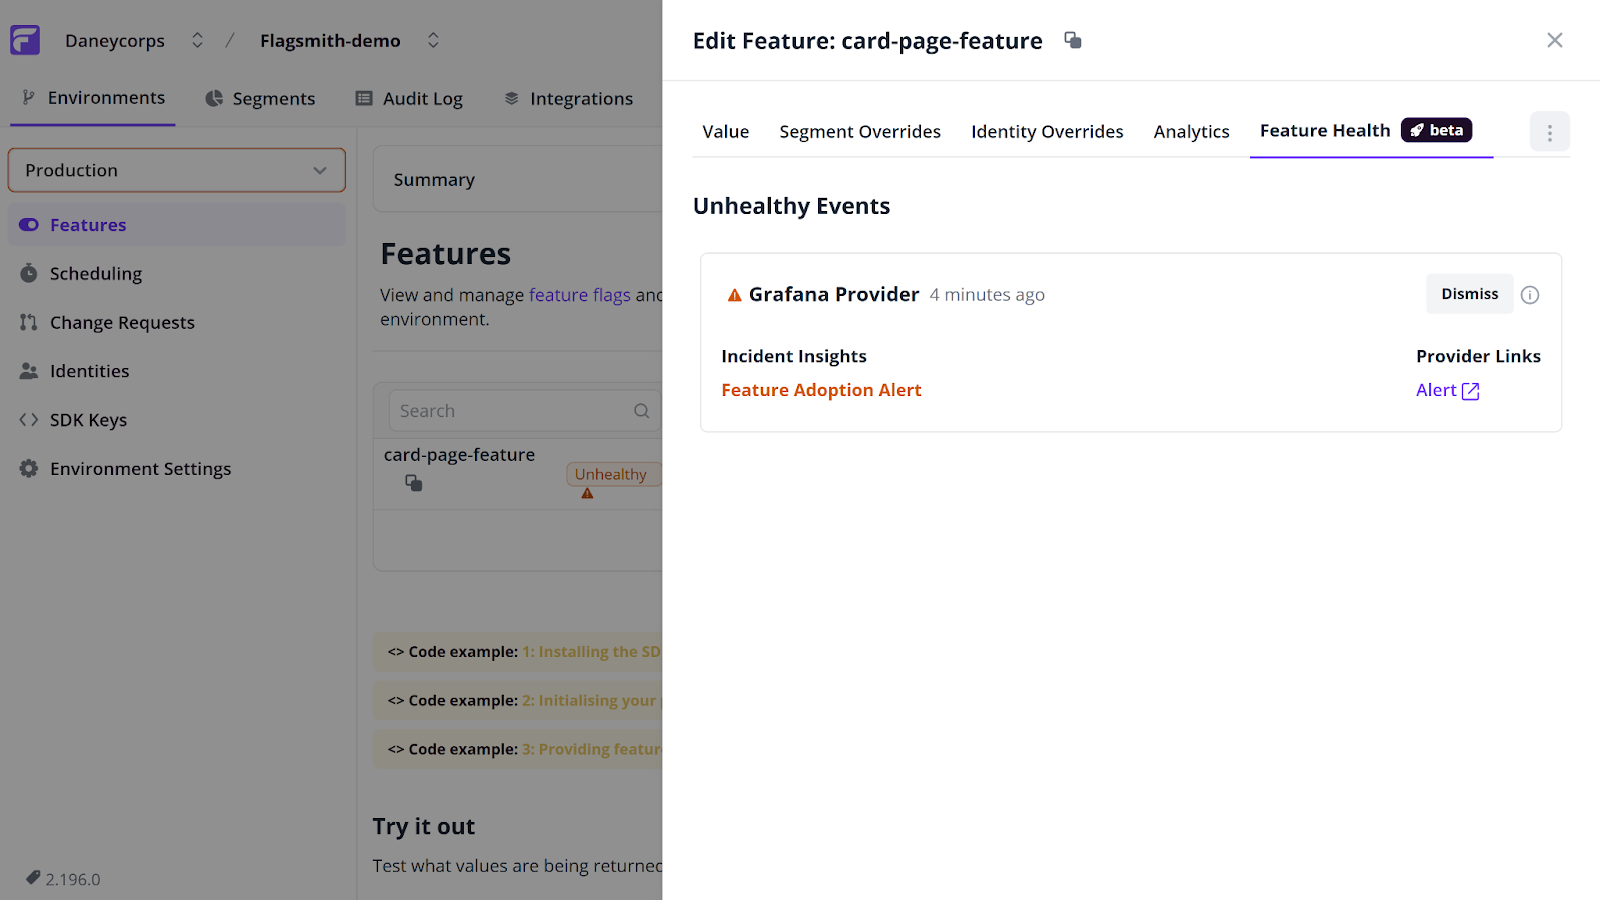
Note: The feature flag in this tutorial is currently marked as Unhealthy. This is because no real usage events, like repeatedly clicking the Card page button, are being generated. In a real-world scenario, consistent feature usage and low error counts would see the flag transition into a Healthy state.
Conclusion
So far, you have learned how to set up feature flagging in a demo project using Flagsmith, a popular feature flag management tool. You also learned how to monitor feature performance with Prometheus and Grafana, and how to send alerts to Flagsmith’s Feature Health system to track the status of your flags.
As you move forward, consider incorporating these practices into both new and existing projects to improve visibility and control over your features.
You can find the complete code for this tutorial on GitHub.


OpenTelemetry, without the vendor lock-in: Introducing full observability for Open Source and Self-Hosted Flagsmith customers


.png)
.png)

.png)

.png)


.png)


.webp)