
Get The Analytics You Need: A/B Testing with Feature Flags and Your Existing Stack


How do you get the most out of your analytics with feature flags? Do you need A/B testing and experimentation to be built into your feature flagging tool?
In most cases—and for most A/B tests—you’ll get stronger metrics and be able to make better decisions by A/B testing with feature flags and the existing tools in your stack.
Here’s why. A/B tests in development often fit into the following categories:
- Rollouts - These are percentage-based. They involve monitoring the performance of the application or other critical metrics and are operational in nature. To understand the results and behaviour, use different tools in your stack together—observability tools, analytics tools, and feature management tools.
- Split testing for qualitative feedback - These tests don’t need to have statistical significance and it can be argued that they aren’t truly A/B tests. Rather, these are a great method of learning how samples of populations react to different experiences.
- A vs. B for accuracy - For true accuracy, these need statistical significance, which means thousands and sometimes millions of visitors… or even worse, long periods of time. Most tests don’t meet this threshold because they don’t have the time or traffic to be accurate enough.
- Multivariate (MVT) tests - Even more traffic is required and even more variables must be considered.
With these categories in mind, most A/B tests in the development process aren’t A/B tests for statistical significance. And they aren't based on purely statistical data—they’re qualitative tests or rollouts. To understand the behaviour of these tests and make informed decisions, you'll need more than the metrics you'll get from an all-in-one feature flagging and experimentation tool.
If you use a specialised feature management tool with your existing analytics tools, you’ll have the metrics you need with the tools that are already in your stack.
All-in-One Solutions vs. Homegrown Solutions vs. Specialised Tools for A/B Tests
The tooling options for A/B testing with feature flags sit on a continuum:
- On one end there are full-suite products that offer feature flagging, A/B testing, and experimentation in a single platform
- On the other, there are teams building fully configured home-grown solutions for both flags and A/B testing
Somewhere in the middle is the option to use specialised analytics tools with specialised feature flag software. With this option, you run A/B tests by automatically feeding event and flag data to your existing analytics platform(s). This is where Flagsmith sits.
Flagsmith lets you integrate your A/B and multivariate results with your existing behavioral, database, and performance monitoring tools.
This means you’re not adding another decision point. Instead, you’re using specialised tools together. You can get data in and out of feature flags and use that data to run A/B tests with your existing stack. These tests will be fed with enough data and metrics for your PMs, marketing teams, etc. to make data-driven decisions.
Why Use Feature Flagging Tools with Analytics Tools
Keep a single decision point for analytics
Don’t add another decision point. Run experiment analysis in your team's source of truth (and have that be informed with enough event and flag metrics to make data-informed decisions).
Keep looking at the right sources of data
The metrics from an all-in-one feature flag and experimentation platform are likely not enough for a PM, engineer, or marketer to make an informed decision. Feeding tests with flag data and analysing them with your existing tools (analytics, observability, etc.) will go further.
Keep the tools that work for your teams
Your marketing team might use Grafana for marketing-led tests. Your product team might use Amplitude. You might use behavioural tools like Dynatrace. Rather than adding another analytics tool (or using a tool that isn’t accessible for other teams, leaving you as the gatekeeper) keep using tools that work and feed flag data into them.
Keep costs down and don’t get locked into something you won’t use
Using a feature flag tool with your existing infrastructure/stack can enable engineers and save costs. Introducing more decision points adds tooling costs (and can lead to pricier tools with features you don’t touch), increases storage, and can create hidden costs like the organisational costs that come from discrepancies in data. Plus, you might be paying for features you don’t need.

Why We Chose to Integrate with Analytics Platforms
We want to build a specalised feature flag tool, and have chosen not to be an all-in-one solution or add features that would compete with your analytics tools. Instead, we specialise in flags and partner with analytics providers.
We want to make it simpler—and cheaper—for teams to keep making decisions where they are today. We do that by making it easy to get data through integrations or webhooks.
How to Use Flagsmith for A/B Testing with Feature Flags
TL;DR: We integrate and partner with analytics tools, offer webhooks and have a REST API. People also create custom builds for tests and event feeds—read our case studies or ask in Discord to find out how they’re implementing these.
You can set up and run A/B Tests with multivariate flags and flag data being fed to a third-party analytics platform like Amplitude or Mixpanel. You’ll need two main components:
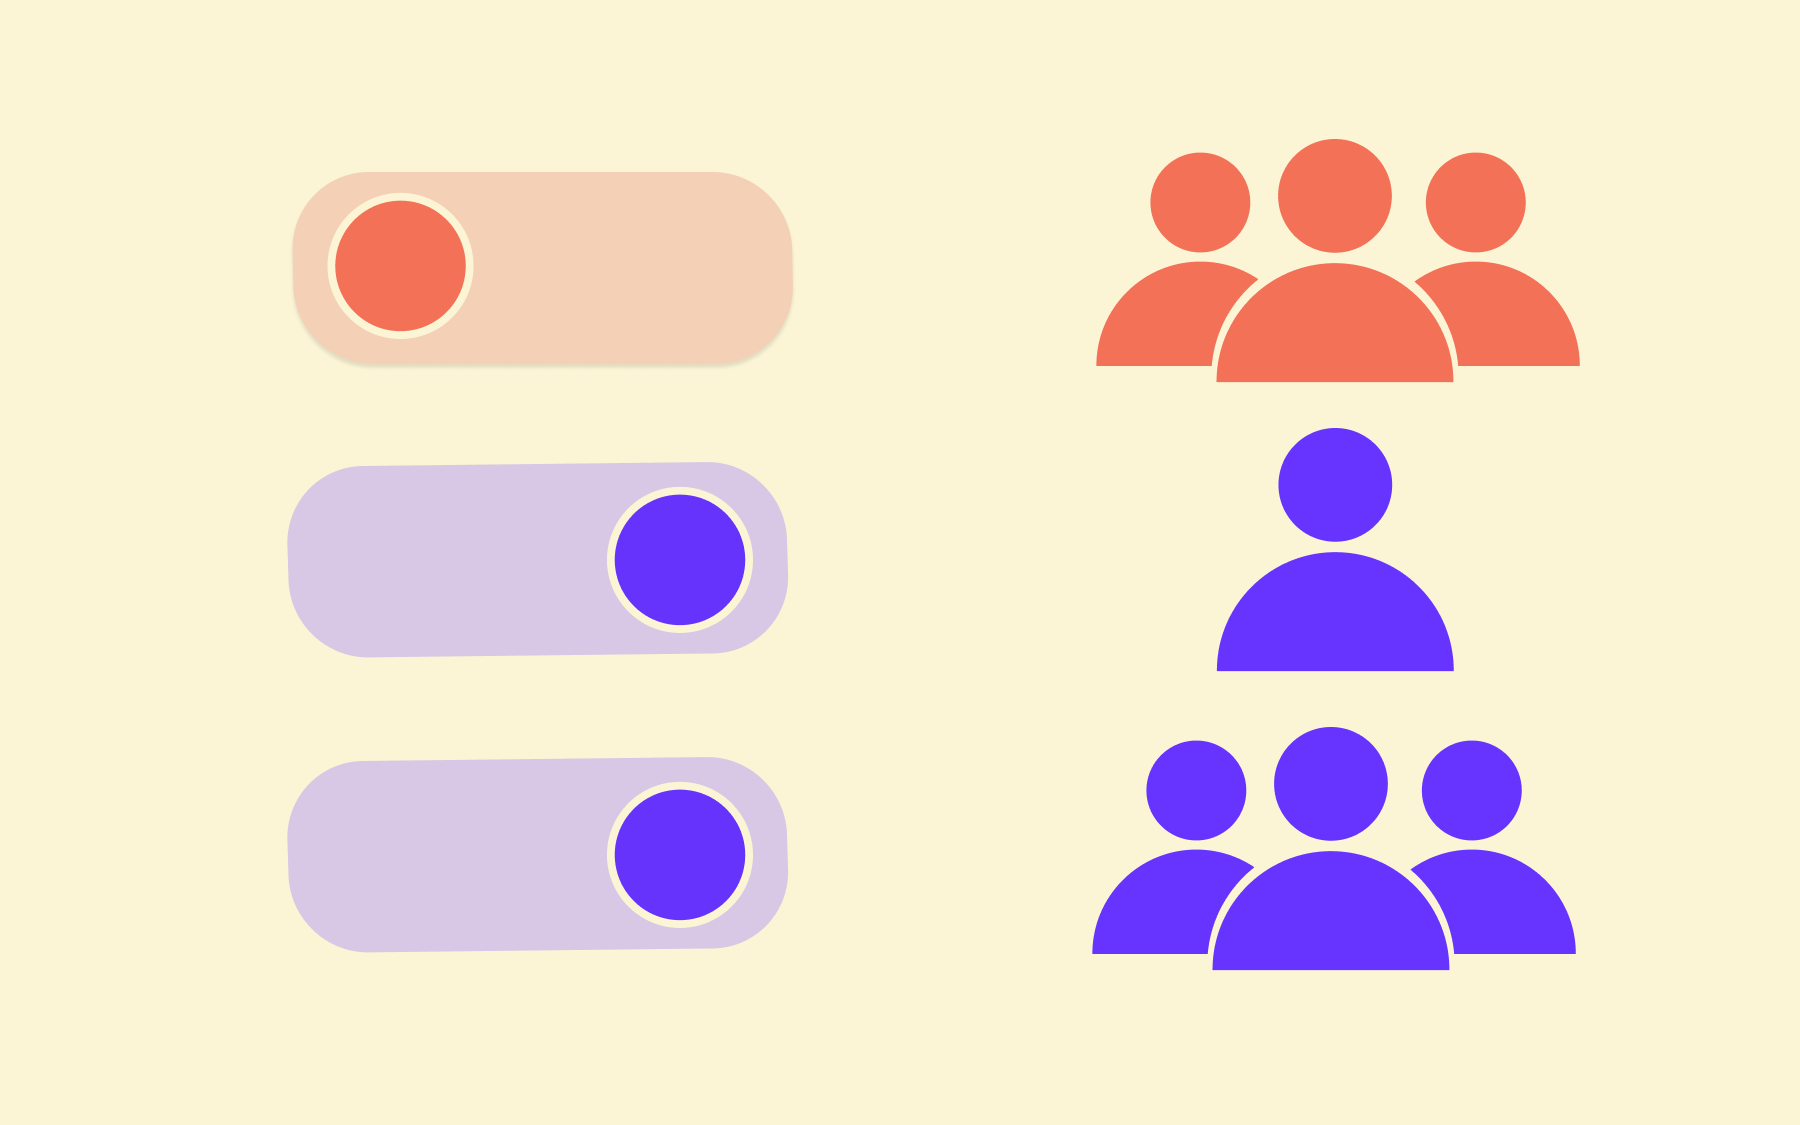
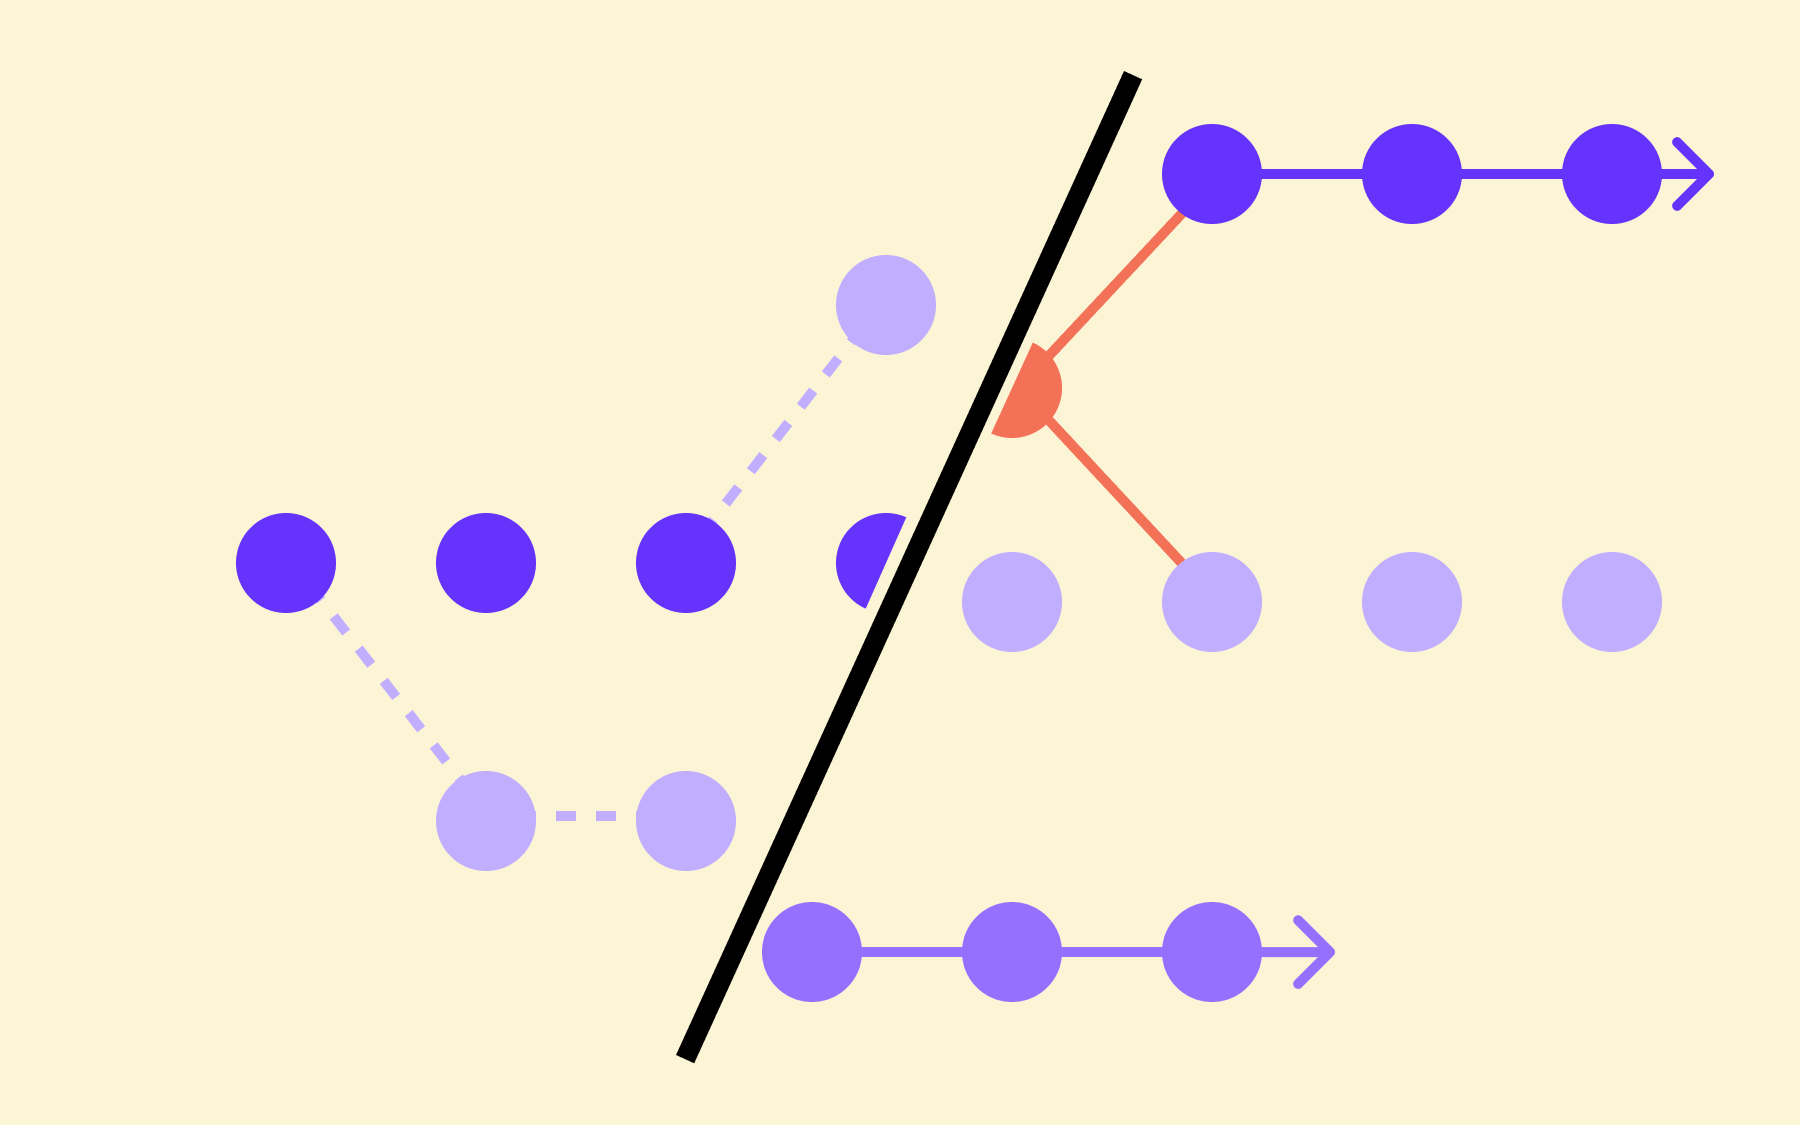
- A bucketing engine: The bucketing engine is used to put users into a particular AB testing bucket. These buckets will control the specific user experience that is being tested.
- An analytics platform: The analytics platform will receive a stream of event data derived from user behaviour.
Read our Docs for more information on setting up and evaluating A/B tests.
Running an A/B Test on App Modals With Flagsmith and Analytics Platforms
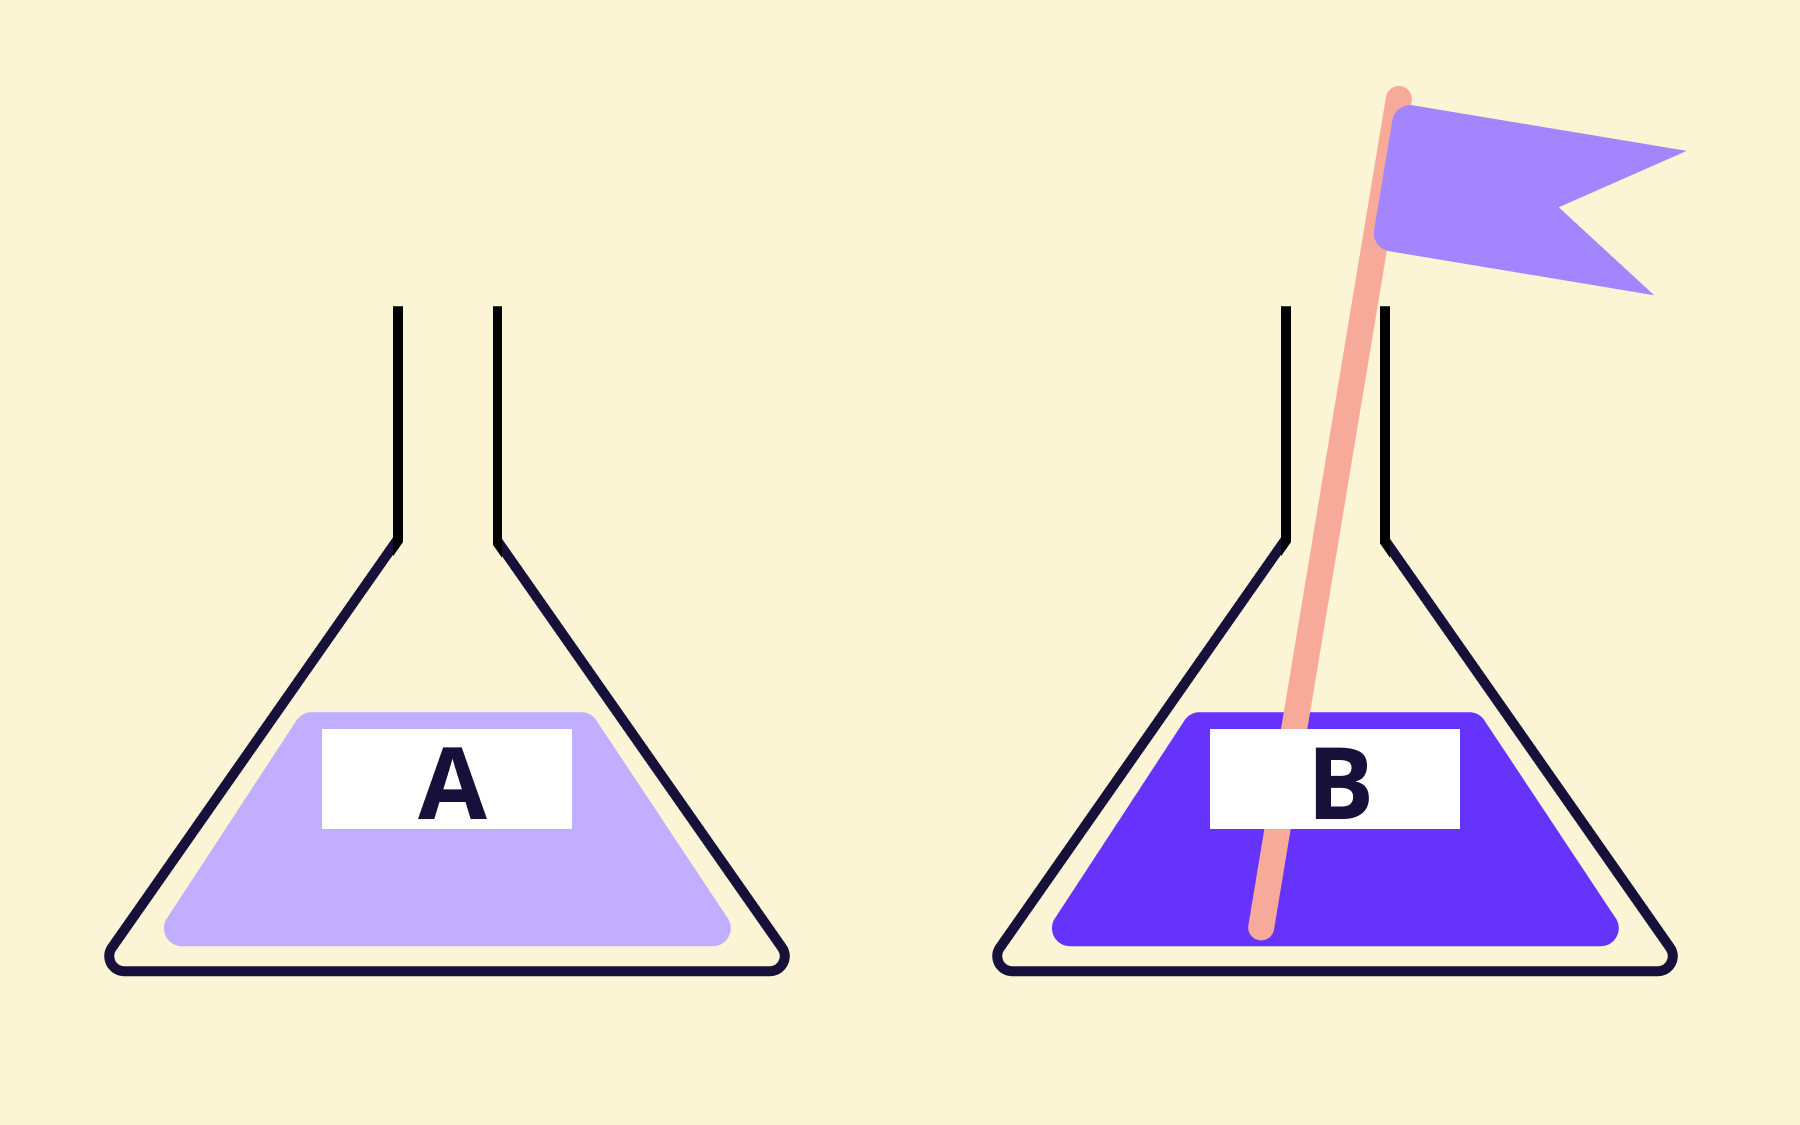
A Fintech team implemented A/B tests when they noticed they weren’t receiving enough feedback from users from a popup modal in their app. They used Flagsmith segmentations with a % segment override.
Users were closing the modal and their Tech Lead thought they were asking for a review at the wrong time for users. To test this, they created two different modals (A and B) in different places in the app. Then, they evaluated how the user feedback varied depending on the modal they saw. They stored the event information in their data warehouse (using Redshift Database), and their Marketing and Product teams used Grafana and analytics tools to measure the results of the experiment.
They implemented the A/B test on their own, using Flagsmith segmentations with a % Segment Override. Then, on their side, they built an event pipeline so that they could send events through the app to the back end to track users’ behaviour.
When they ran the test, option A was by far the better approach for users. After implementing that option for all users, they’re receiving more feedback and the reviews are much better.
Read the full use case and technical implementation here.
More Team Implementations:
- How Inflow Improves Conversions Through A/B Testing
- How eFuse Uses Flagsmith for A/B & Multivariate Testing
Resources to Get Started With Flagsmith and A/B Tests
Docs
Video
Interactive Demo
Conclusion
There are so many ways to build and test. As we’ve built Flagsmith, we’ve decided not to add another decision point or make releasing any more complicated. Instead, we think releases are simpler and more data-informed with specialised tools that just work.
With A/B testing and feature flags, this means using a feature flag tool to send flag data to the analytics platforms your teams are already using.


OpenTelemetry, without the vendor lock-in: Introducing full observability for Open Source and Self-Hosted Flagsmith customers


.png)
.png)

.png)

.png)


.png)


.webp)