
DORA Metrics Explained: The Five Measures of Software Delivery Performance

If you've spent any time around engineering leadership, you've probably heard someone mention DORA metrics. They're the closest thing the software industry has to a shared scoreboard for delivery performance, having originated from Google Cloud's DevOps Research and Assessment programme, which has spent over a decade studying what separates high-performing technology teams from the rest.
The framework originally launched with four key metrics—and most people still encounter it that way—but now includes five.
Instead of arguing about whether a team "feels" fast or stable, DORA metrics give engineering leaders and platform teams a small set of numbers to point to.
They don't replace judgement, but they replace guesswork with something measurable, making conversations between engineering and the rest of the business a lot more productive.
This article covers what the DORA metrics are, how to calculate them, what good performance looks like, and some practical ways feature flags can help teams move two of them in the right direction.
What are DORA metrics?
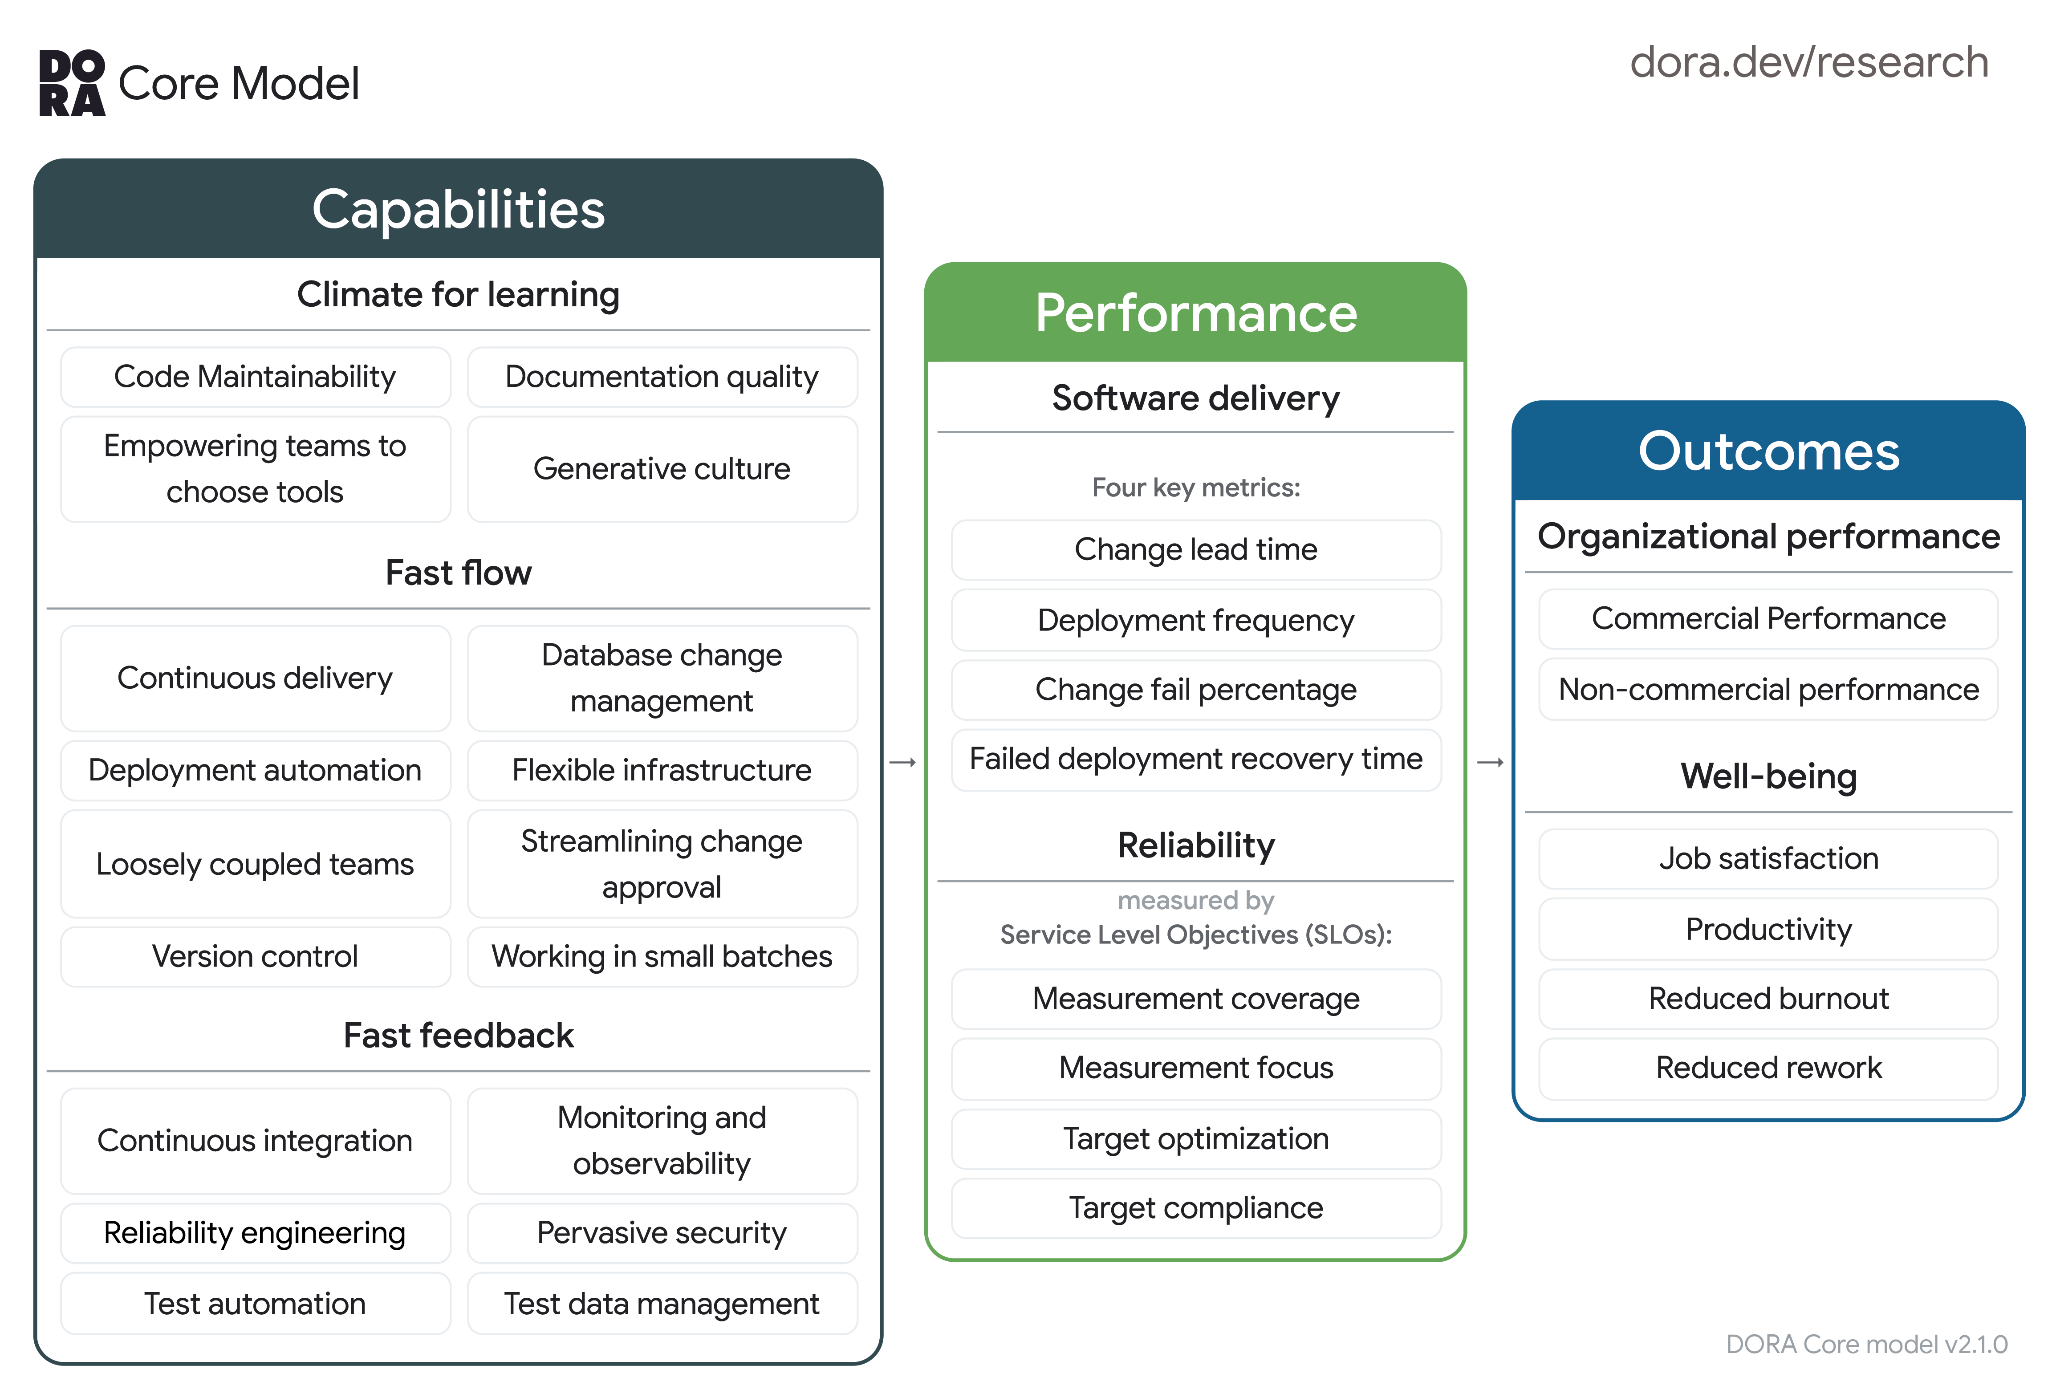
DORA metrics are five measurements used to assess the software delivery process, capturing two things at once: how fast a team ships changes, and how stable those changes are once they're out.
They were developed by the DevOps Research and Assessment group, now part of Google Cloud, and have become one of the standard reference points engineering teams use to talk about delivery performance and make sure they’re moving fast without breaking things.
The five metrics are split into two categories.
- Change lead time, deployment frequency, and failed deployment recovery time measure throughput—how quickly a team can move changes into production.
- Change fail rate and deployment rework rate measure instability—how well deployments go once they're out.
The combination is more important than any single number: a team that ships constantly but breaks things every other release isn't actually performing well, and neither is a team that ships rarely but cautiously.
Implementing DORA metrics improves teams because they make you look at speed and stability together, rather than letting one mask problems in the other.
The five DORA metrics
Deployment frequency
Deployment frequency measures how often an organisation successfully releases code to production.
Elite performers deploy on demand, often multiple times a day, treating deployment as a routine, low-drama event. Lower-performing teams might deploy monthly, or even less often, usually because each release requires significant manual coordination, sign-off, or testing effort.
This metric is really a proxy for something deeper: how much friction sits between the code being "ready" and the code being live.
High deployment frequency combined with solid stability metrics means the path to production is short, automated, and trusted enough that nobody needs to hold their breath every time something ships.
By comparison, a team deploying constantly with a high change failure rate and slow recovery time is just shipping problems faster.
Lead time for changes
Lead time for changes is the time it takes from a code commit being made to that code running successfully in production. It's one of the cleanest ways to measure how efficiently a team moves from idea to delivery, because it captures everything in between: code review, testing, approvals, and the deployment pipeline itself.
A short lead time usually points to a healthy development process: small batches of work, fast code reviews, and a deployment pipeline that doesn't require a human to babysit it.
A long lead time, on the other hand, often signals bottlenecks that have nothing to do with how good the code is—things like slow review cycles, manual testing gates, or infrequent release windows.
Change failure rate
Change failure rate is the percentage of deployments that cause a failure in production, requiring a hotfix, rollback, or patch. It's the natural counterbalance to deployment frequency: shipping often is only a good thing if what you're shipping mostly works.
This metric keeps deployment frequency honest. A team could technically increase how often it deploys by cutting corners on testing, but that would show up immediately as a rising change failure rate.
Reading the two metrics together is what makes DORA metrics useful, rather than just a vanity measure of how busy a team looks.
Failure recovery time
Often called time to restore service, this metric measures how long it takes a team to recover when a production failure happens.
It's a measure of resilience rather than prevention: every team will eventually ship something that breaks, and this metric asks how effectively they handle it when that happens.
Teams with fast recovery times tend to have good monitoring, clear ownership of incidents, and a quick path to either roll back or disable the problematic change. Teams with slow recovery times are often missing one of those three things, which turns small mistakes into prolonged outages.
Deployment rework rate
Deployment rework rate, the newest DORA metric, measures the ratio of deployments that are unplanned but happen as a result of an incident in production.
Where change failure rate captures deployments that immediately require intervention, rework rate captures the reactive deployment work that follows—the patches, fix-forwards, and emergency releases that consume engineering time that was supposed to go elsewhere.
A high rework rate is a signal that a meaningful proportion of deployment activity is driven by firefighting rather than feature delivery. It sits alongside change failure rate as the second instability metric, the two together providing a clearer picture of how much of a team's shipping capacity is eaten by fixing the consequences of previous releases.
Why DORA metrics are important
The five software delivery performance metrics capture speed and stability at the same time, without forcing teams to trade one off against the other.
By splitting the process into five metrics, engineering teams can identify bottlenecks in the software development process and potential issues in the production environment.
For example, if you’re launching software at a good pace without causing many failures in production, but the one time you do cause a failure, it takes too long to fix, the issue is in your failure recovery rate.
DORA's research shows that these performance metrics predict better organisational performance and wellbeing for team members, which is a useful thing to be able to say to a sceptical stakeholder who thinks metrics like this are just an engineering vanity project.
One of the key findings from the research is that elite performing teams tend to score well across all five metrics rather than excelling at just one.
Top performers do well across all five metrics, and low performers do poorly, which suggests that speed and stability genuinely reinforce each other in practice, rather than living in permanent tension.
That single point is probably the most useful thing to take away from the whole framework: a team that's "fast but reckless" or "careful but slow" usually isn't actually elite by either measure once you look closely.
For engineering managers, this gives a genuinely useful shared language with the rest of the business. Instead of saying "the team is doing well," you can point to specific, comparable numbers that mean roughly the same thing across different organisations and industries.
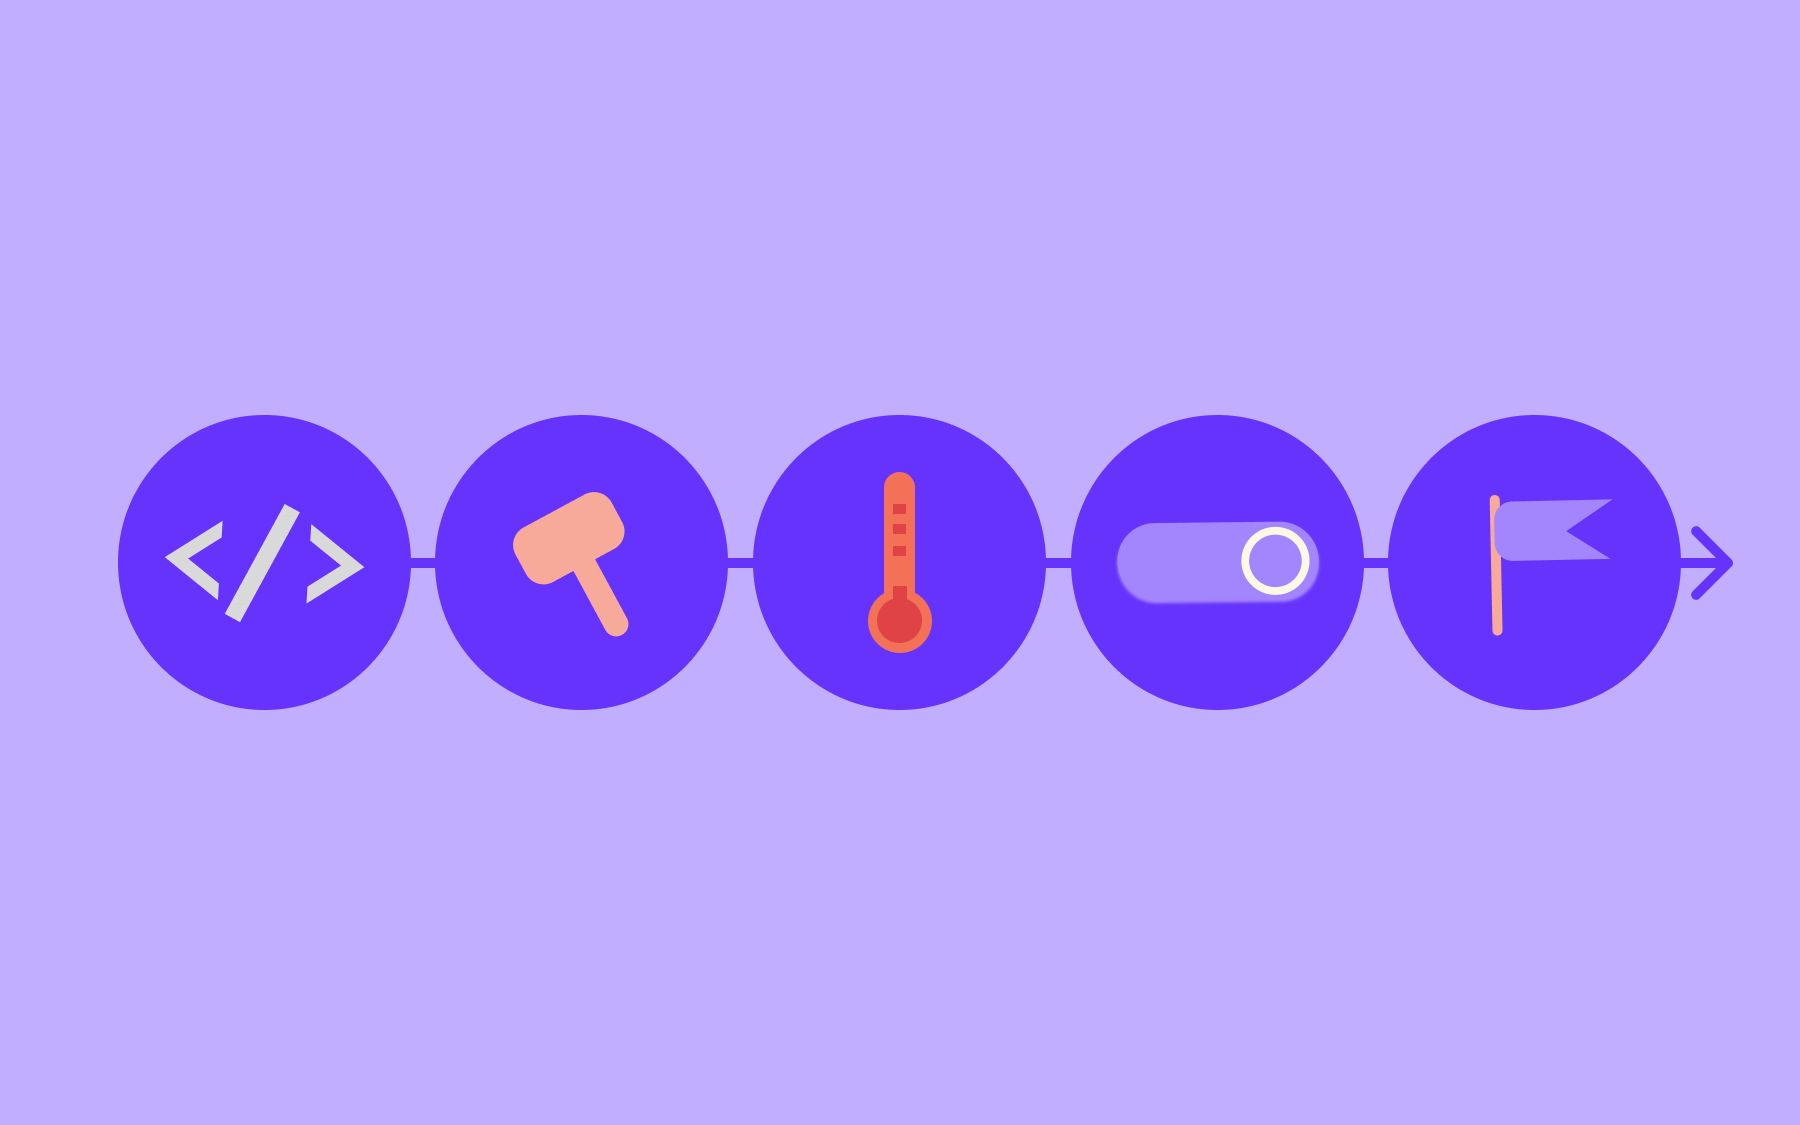
How to calculate DORA metrics
You don't need an enormous amount of infrastructure to start measuring DORA metrics, but you do need data from a handful of different places, since deployment, change, and incident data usually live in separate systems.
In practice, that means pulling from your CI/CD pipeline for deployment timestamps, your version control system for commit history (to calculate lead time), and your incident management tools for recovery records.
None of these are hard to track individually, but stitching them together so the numbers line up correctly usually takes the most setup effort, since deployment, change, and incident data are typically scattered across several different tools.
You don't need perfect precision to get started. A rough baseline, even one built from a few weeks of manual data collection, is enough to see roughly where you stand and start tracking whether things are improving.
DORA performance tiers
DORA's research has historically grouped teams into four performance tiers—elite, high, medium, and low—based on how they score across the metrics.
The most recent year this model was published in full, the 2024 Accelerate State of DevOps Report, found that elite performers made up roughly 19% of respondents, deploying on demand with under a day's lead time and recovering from failures in under an hour.
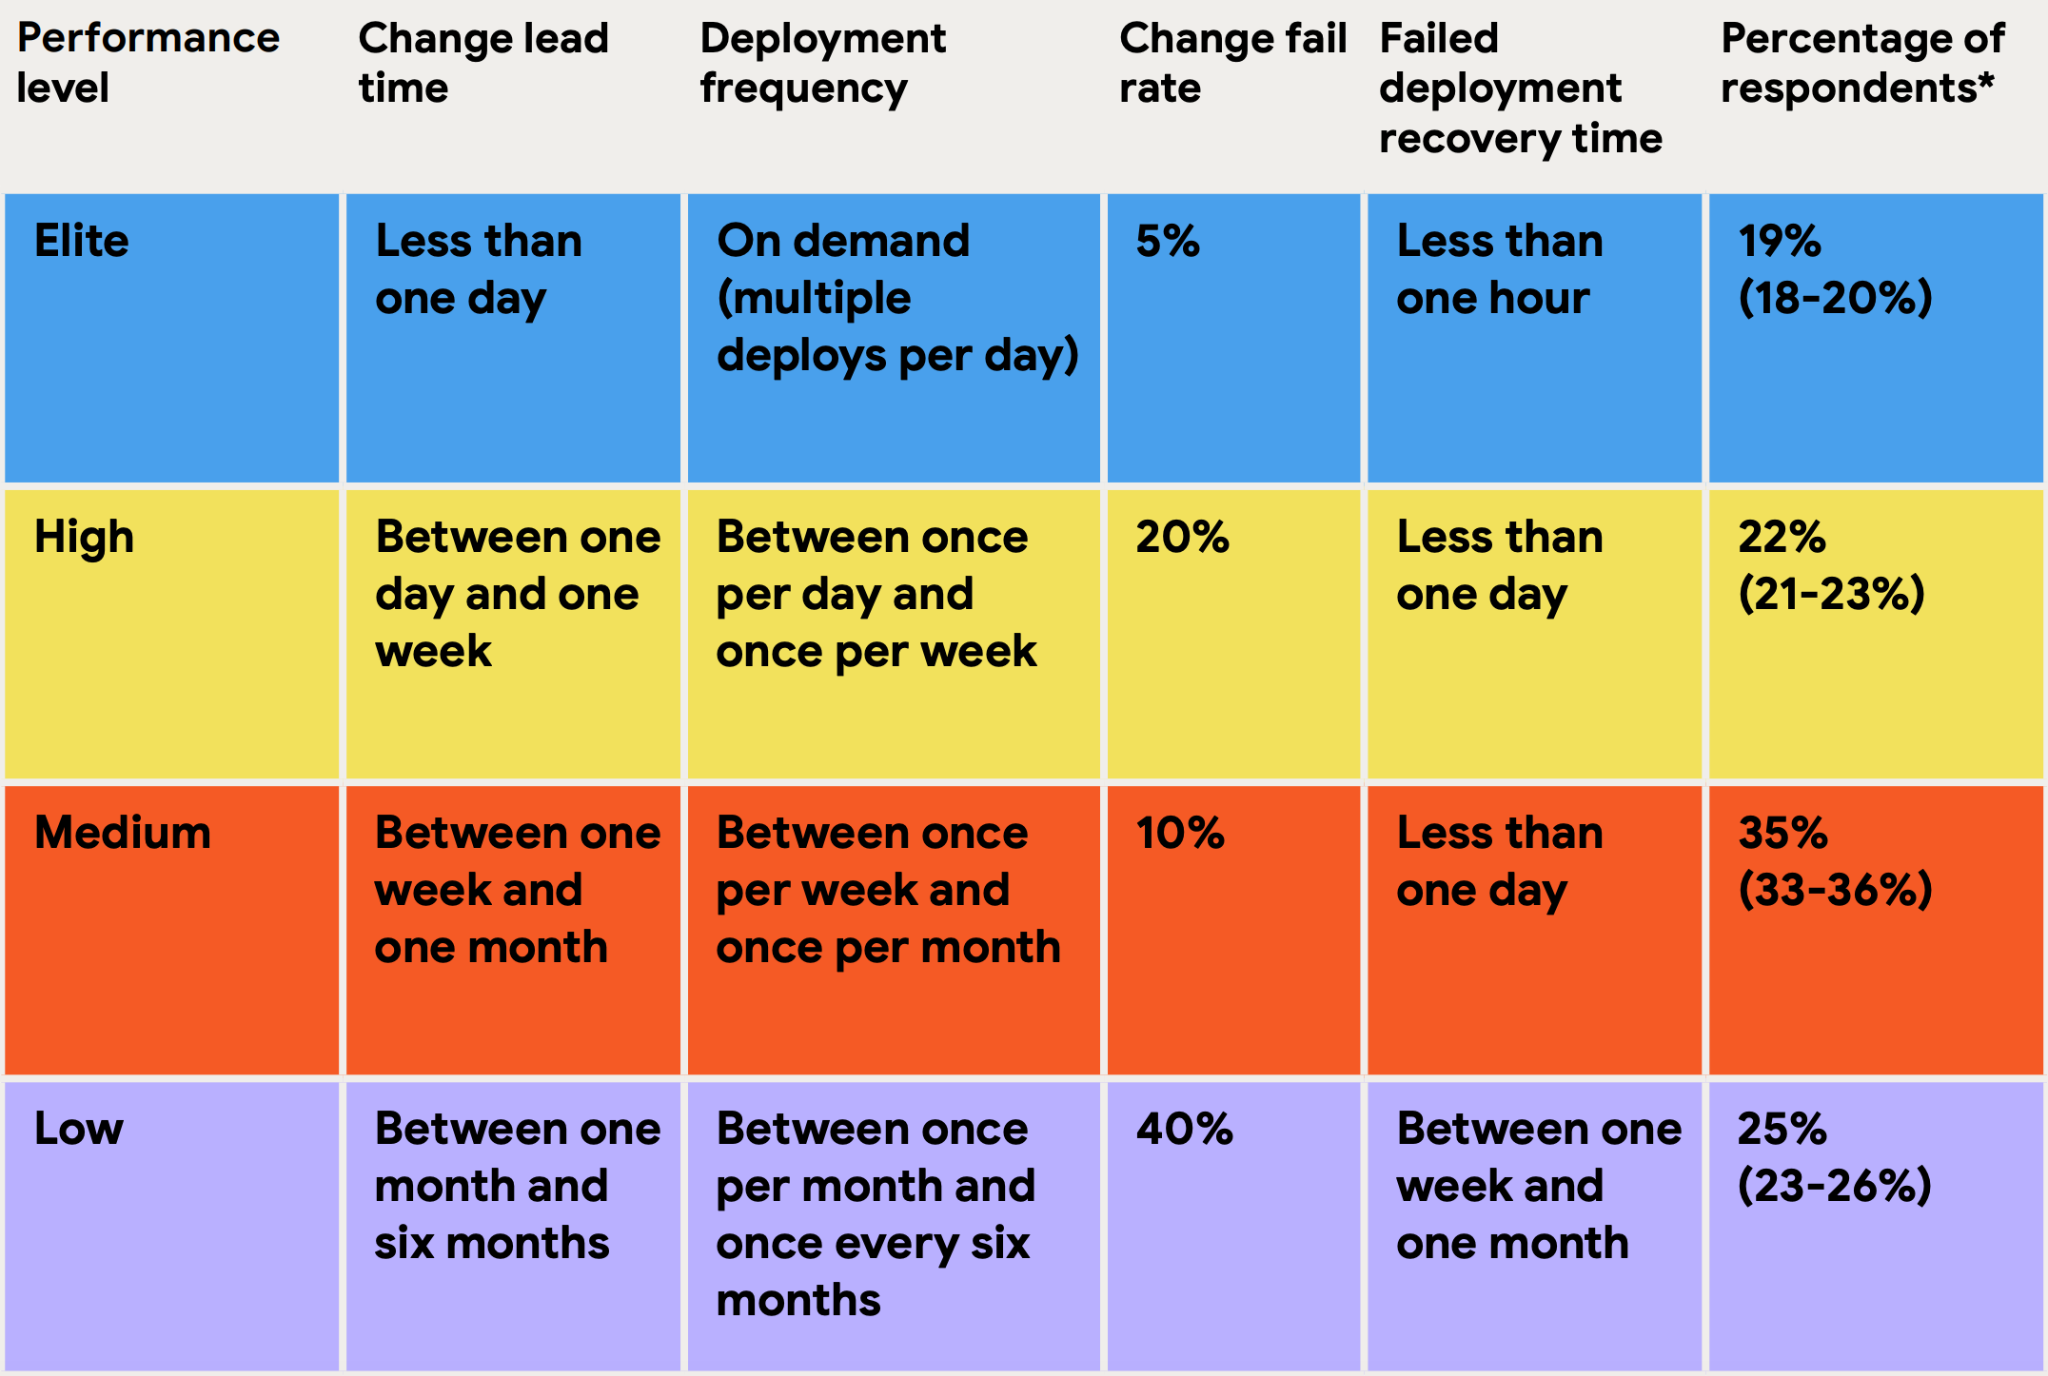
If you're benchmarking yourself against these tiers, the boundaries aren't fixed numbers that stay the same every year. They shift based on how the wider industry is performing, since the tiers come from clustering survey responses rather than from predetermined targets.
The 2024 report, for instance, found the high-performing tier had shrunk noticeably compared with the year before, while the low-performing tier had grown, a reminder that industry-wide delivery performance isn't a one-way ratchet upward.
DORA's most recent research has moved away from this four-tier model in favour of a more nuanced set of team profiles that account for human factors like burnout alongside the raw delivery numbers.
The tiers are still a genuinely useful mental model for getting oriented, but treat the exact thresholds as a snapshot from a particular year rather than a permanent yardstick.
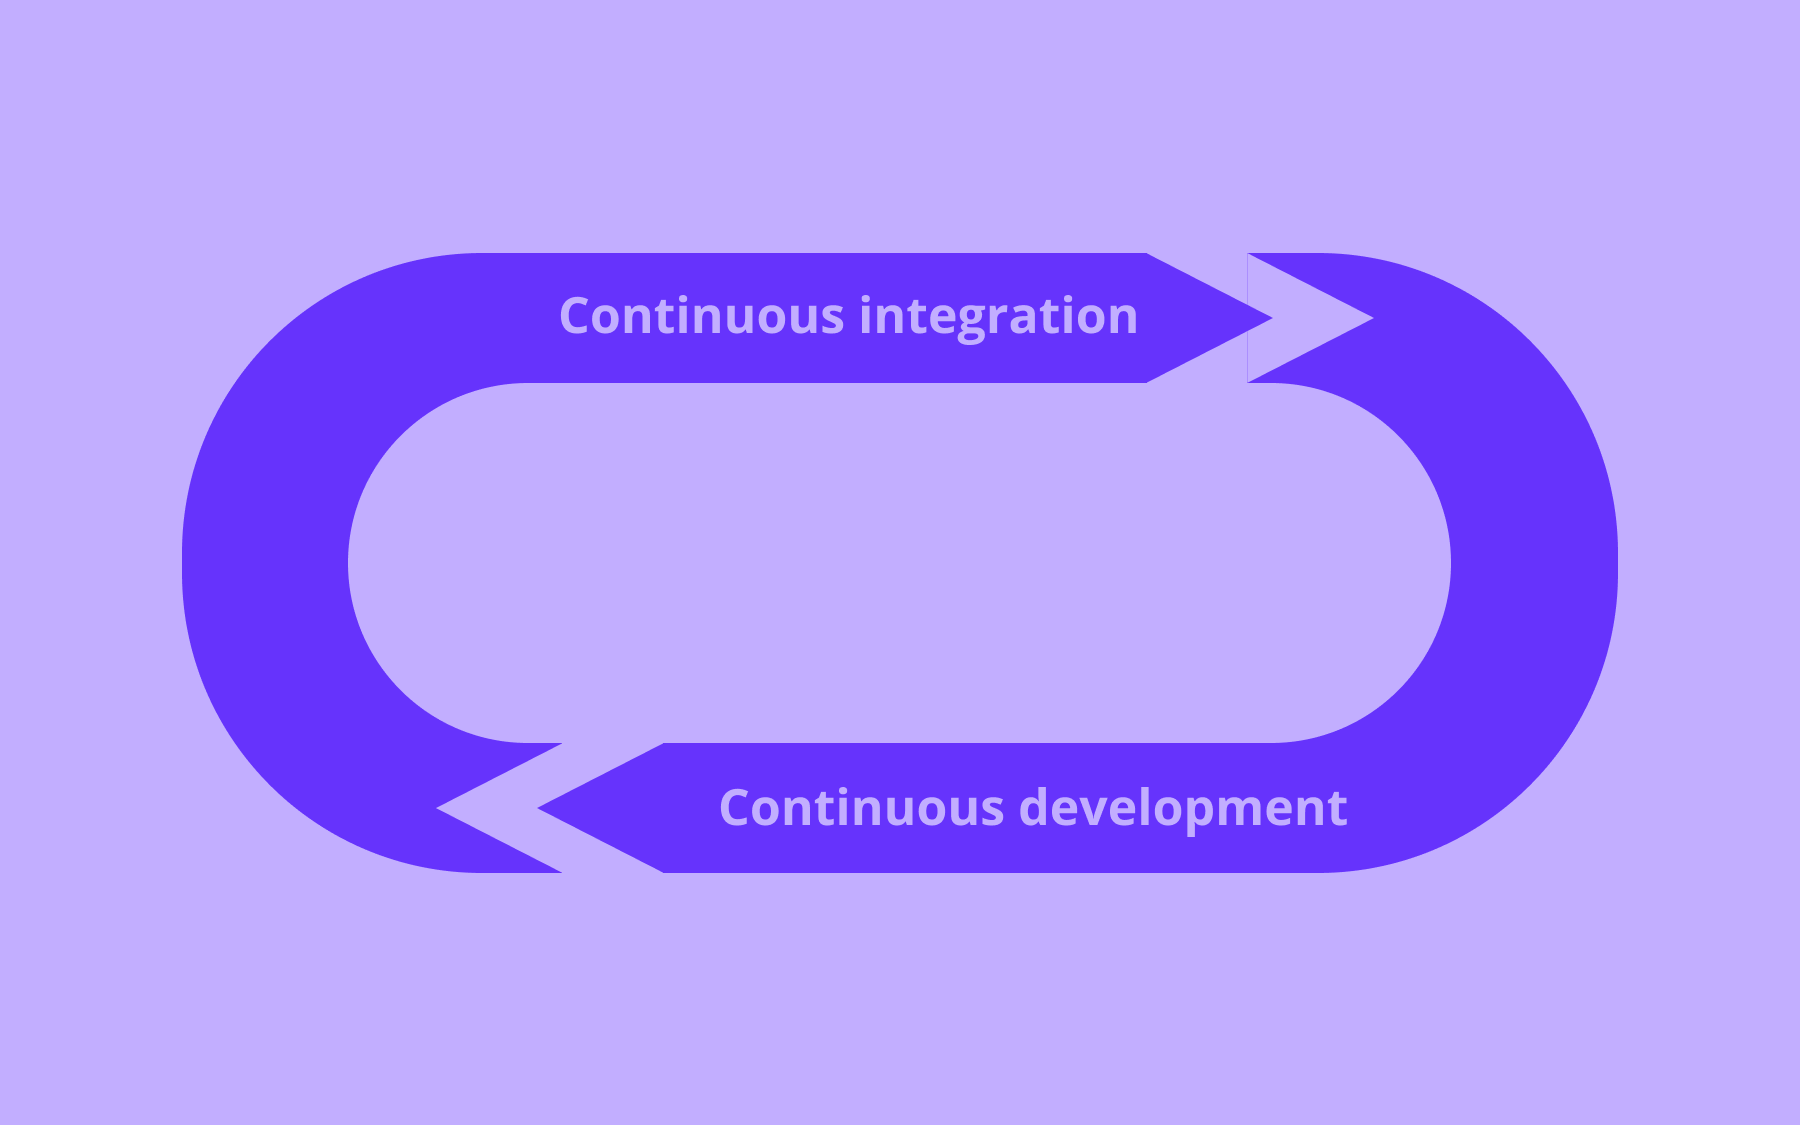
How feature flags support DORA metrics
Feature flags are a complement to good DevOps practice, not a replacement for the underlying engineering work that DORA metrics actually measure.
A team with a slow, manual release process won't fix that by bolting on a feature flagging tool. However, for two of the five metrics specifically, flags genuinely help.
The mechanism is decoupling deployment from release.
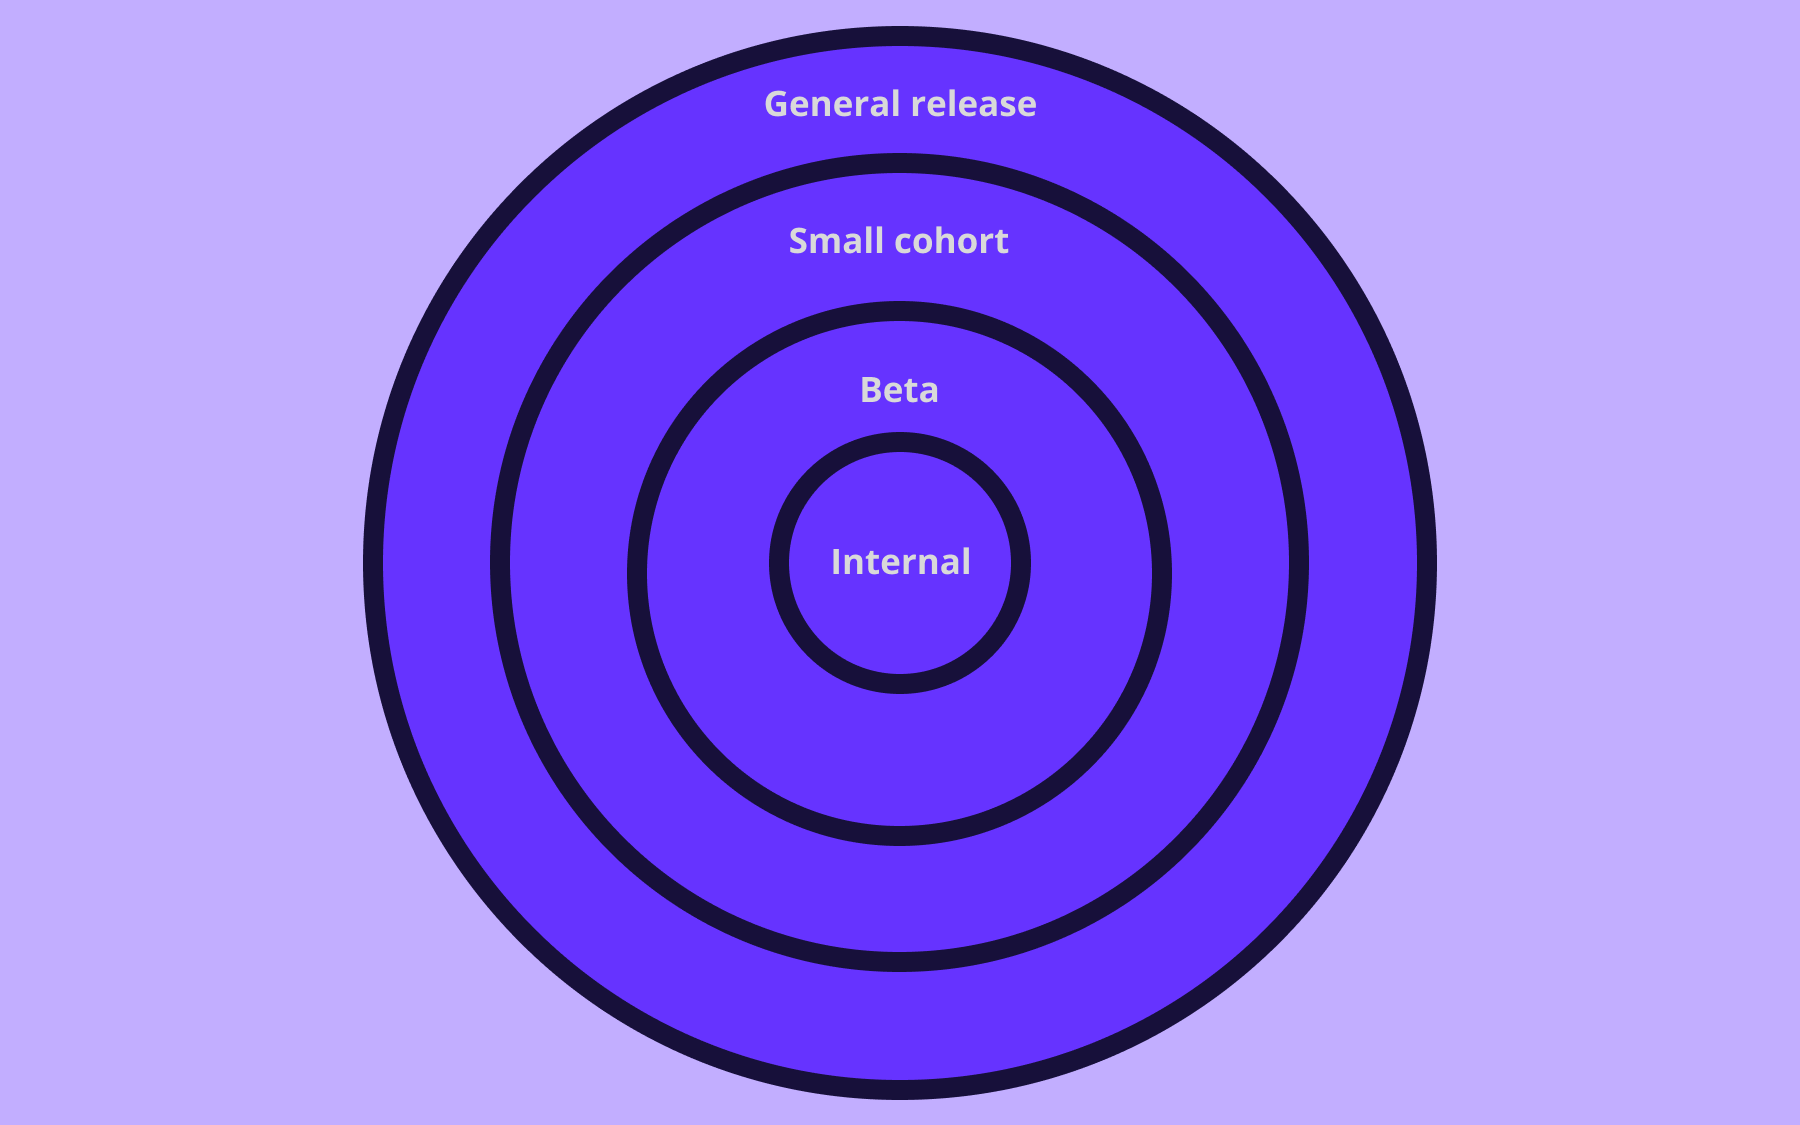
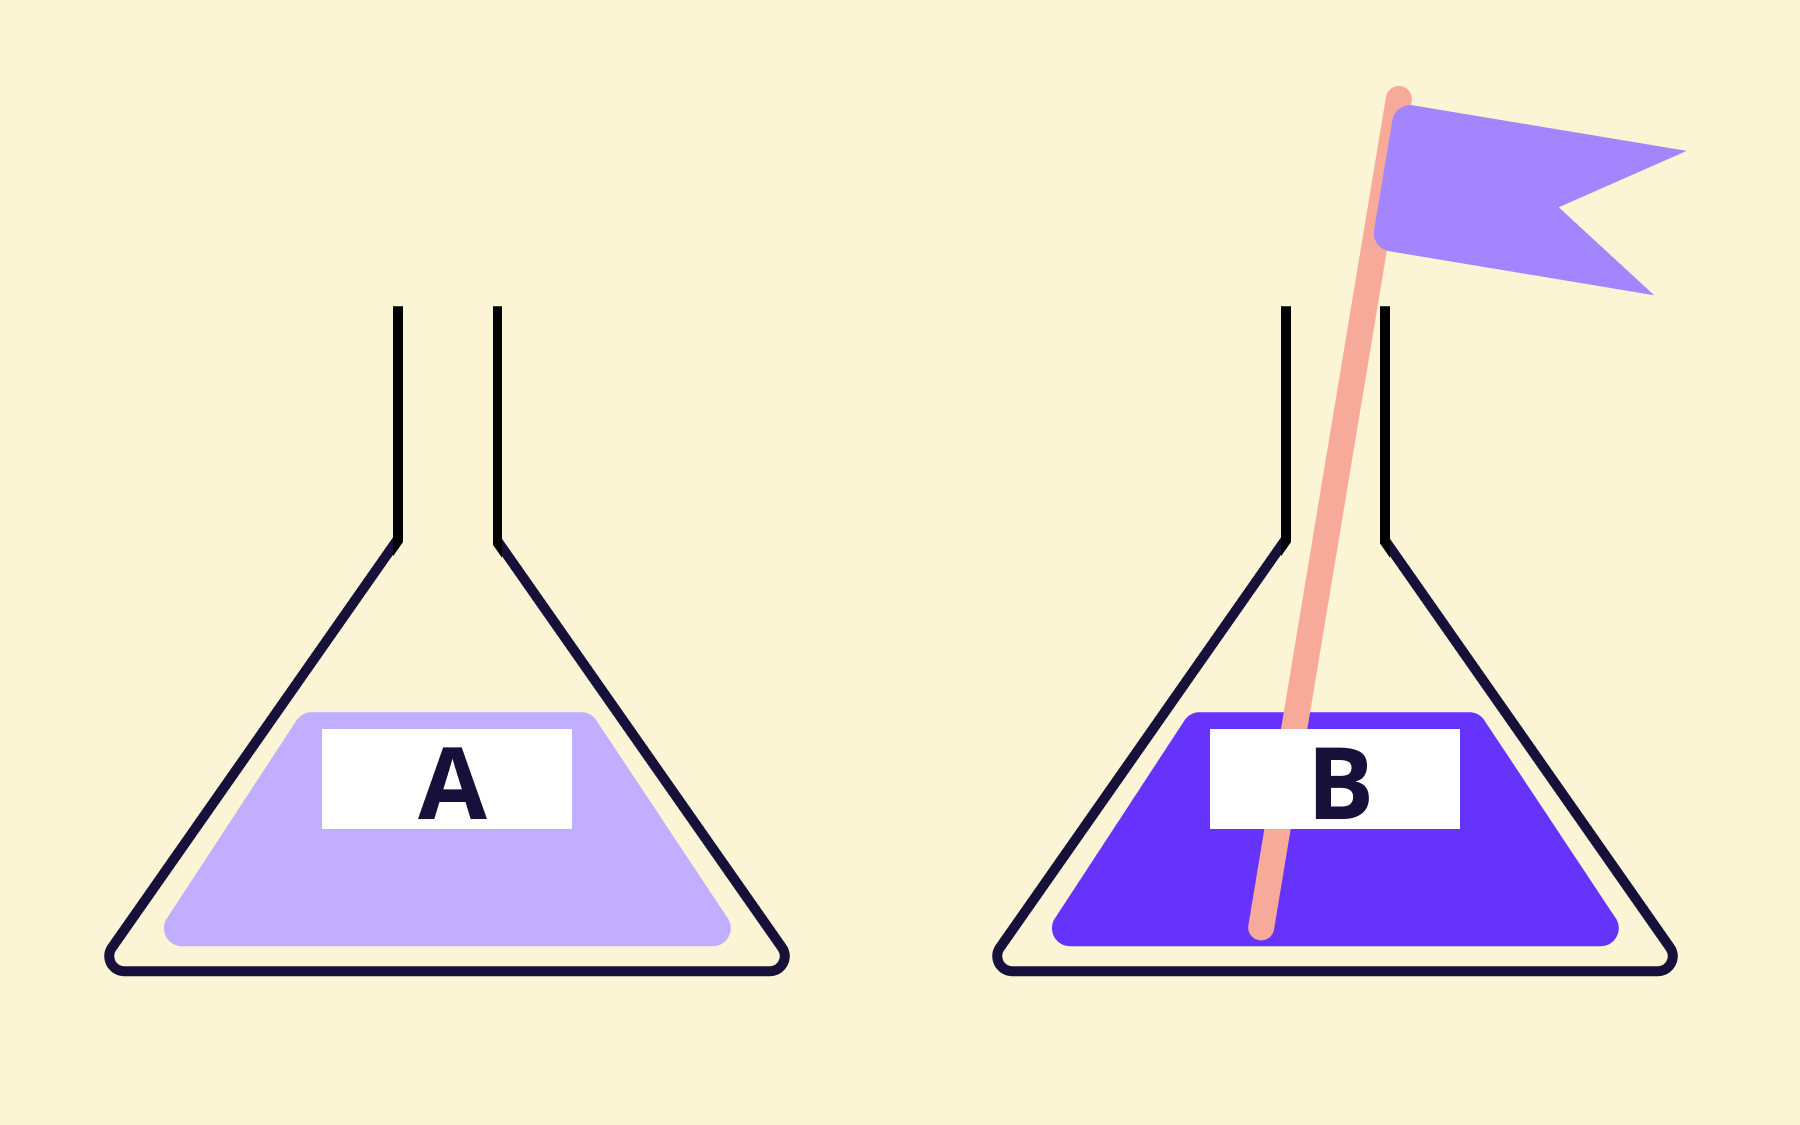
Feature flags enable teams to push code to production without immediately switching it on for every user. That separation supports higher deployment frequency, as shipping code no longer has to mean exposing it to everyone at once, lowering the perceived risk of each individual deployment.
That same wrapping mechanism helps with change failure rate, too. Risky or incomplete changes can be rolled out gradually, perhaps to a small percentage of users first, which means that if something does go wrong, it affects a much smaller slice of the user base before anyone notices and catches it.
Recovery time is where the effect is most direct. When something goes wrong with a flagged feature, switching it off is typically a matter of seconds, not a full rollback or redeploy. That speed difference improves failure recovery time specifically, since the whole point of that metric is how quickly a team can get back to a stable state.
Lead time for changes is the one metric flags don't meaningfully move on their own. That number is mostly a function of code review speed, testing rigour, and how the development process itself is structured, none of which a feature flag changes directly.
Flagsmith is a feature flag management platform built around this kind of progressive rollout and kill switch functionality, letting teams wrap changes in flags and adjust who sees them without needing a new deployment.
Common challenges when adopting DORA metrics
A few obstacles tend to come up once teams start trying to measure this properly.
The most common is fragmented data. Deployment records, commit history, and incident logs often live in entirely separate tools that were never designed to talk to each other, which makes pulling together an accurate picture more work than people expect going in.
Teams can also end up optimising for the numbers rather than the underlying outcome the numbers were meant to represent.
Setting metrics as a goal, with broad statements like demanding every application deploy multiple times a day by year's end, increases the likelihood that teams will try to game the metrics rather than genuinely improve.
If deployment frequency becomes a target in itself, you can hit the number by deploying trivial, low-value changes more often without actually getting better at anything that matters.
DORA metrics are diagnostic tools for finding where to focus improvement effort, not a scorecard for ranking individual engineers or comparing unrelated teams against each other. Used that way, they tend to create exactly the kind of defensive, blame-driven culture that hurts the stability metrics they're supposed to track.
Conclusion
DORA metrics give engineering teams a genuinely useful, shared way to measure and improve both delivery speed and stability, rather than treating the two as competing priorities.
Deployment frequency and lead time for changes tell you how quickly ideas reach users. Change failure rate, deployment rework rate, and failure recovery time tell you how well those changes hold up once they're there.
If deployment frequency and change failure rate are two numbers you're looking to improve, feature flags are a practical place to start. Flagsmith lets teams decouple deployment from release and switch problematic changes off in seconds rather than hours, which helps to get those two specific metrics moving in the right direction.
Try Flagsmith for free to see how progressive delivery and kill switches fit into your existing deployment process.
DORA metrics FAQs
What is a good DORA metrics score?
There isn't a single universal "good" score, since DORA groups teams into performance tiers rather than setting one fixed target.
Broadly, elite performance means deploying on demand, recovering from failures in under an hour, and keeping change failure rate low. The more useful question for most teams is, “Are we improving year over year?"
Who created DORA metrics?
DORA metrics were created by the DevOps Research and Assessment team, founded by Dr Nicole Forsgren, Gene Kim, and Jez Humble. The group is now part of Google Cloud, and their research has been published annually for over a decade.
How often should DORA metrics be measured?
Most teams benefit from tracking DORA metrics continuously, since deployment and incident data accumulate naturally as part of normal operations.
Reviewing trends monthly or quarterly is usually more useful than reacting to single-day spikes, since the real value is in spotting whether performance is moving in the right direction over time.


OpenTelemetry, without the vendor lock-in: Introducing full observability for Open Source and Self-Hosted Flagsmith customers


.png)
.png)

.png)

.png)


.png)


.webp)