
OpenTelemetry, without the vendor lock-in: Introducing full observability for Open Source and Self-Hosted Flagsmith customers


TL;DR
- Open Source and Enterprise Editions of Flagsmith now support OpenTelemetry (OTel), adding distributed tracing and structured logs to complement existing Prometheus metrics.
- OTel instrumentation is fully opt-in: configure a single environment variable to enable it, and there's zero runtime overhead if you don't.
- Prometheus plus OpenTelemetry gives self-hosted teams a complete, open-standards observability stack that works with Grafana, Jaeger, SigNoz, Datadog, and more.
We’re happy to announce that we’ve released OpenTelemetry support for users who are self-hosting Flagsmith. Combined with existing Prometheus metrics, self-hosted deployments now have a full, open-standard observability stack—traces, metrics, and logs—without the vendor lock-in.
Why observability matters for self-hosted feature flag platforms
Most teams don't know their flag infrastructure is struggling until it's already hurting them.
When you self-host Flagsmith, you need to be able to inspect performance:
- When requests slow down.
- Why a database query is taking longer than it should.
- What your system was doing at the exact moment something went wrong.
Good observability doesn't just help you fix problems faster, it acts as the canary in your engineering coalmine to ensure small problems don’t turn into big ones.
In general, observability runs on three signals:
- Metrics—numbers over time: request counts, error rates
- Traces—the path of a single request through your system
- Logs—structured records of what happened and when
Historically, getting all three meant stitching together different agents, formats, and vendor SDKs. The more tools in your stack, the harder it becomes to correlate data across them. Every new tool added another translation layer. Another place where signals got lost.
OpenTelemetry was built to end that.
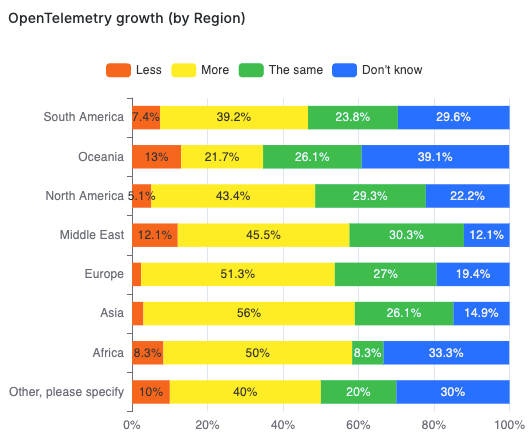
A single, vendor-neutral standard for collecting and exporting all three signals. According to Grafana Labs' fourth annual Observability Survey, usage has grown substantially over the last year. We don’t see this as a trend. We see this as THE standard and ultimately why we decided to invest in bringing it to all of our self-hosted versions.
The key benefits of Flagsmith's OpenTelemetry support
Instrument once. Send data anywhere.
Flagsmith now produces OTel-compatible traces and logs in the same format as every other OTel-instrumented service in your infrastructure. Correlating a slow flag evaluation with a database query or a downstream service call no longer requires translating between formats. The data speaks the same language because it comes from the same standard.
This means that you get:
- Distributed tracing out of the box
- Logs and traces are correlated automatically
- Correlated SQL queries
All of this with your choice of backend—OTLP works with Grafana Tempo, Jaeger, SigNoz, Datadog, and many more—and no performance overhead when your exporter endpoint is not configured.
Get started with Flagsmith and OpenTelemetry
To get started, you just need to set one environment variable. Set OTEL_EXPORTER_OTLP_ENDPOINT on the Flagsmith API to your OTLP/HTTP collector endpoint, and tracing and log export start automatically.
api:
  environment:
    OTEL_EXPORTER_OTLP_ENDPOINT: http://otel-collector:4318
For more advanced options, check out the full configuration reference in our OpenTelemetry documentation.
How Flagsmith, OpenTelemetry, and observability tools work together
Flagsmith has supported Prometheus metrics and Grafana for some time. OpenTelemetry completes the picture.
OpenTelemetry standardises what gets collected and how it's exported. Prometheus handles time-series metrics. Grafana ties it together with visualisation and alerting across both. Each layer does one thing well. Nothing overlaps. Nothing conflicts.
The typical self-hosted observability setup now looks like this:
- Prometheus handles your metrics. Enable the /metrics endpoint with PROMETHEUS_ENABLED=true, and Prometheus scrapes it on a schedule—request duration histograms, cache hit/miss counters, task processor stats, all stored as time-series data ready for querying.
- Grafana visualises and alerts. Grafana queries Prometheus for metrics dashboards and your OTel backend—Grafana Tempo, for instance—for traces. A natural fit, given how deeply Grafana integrates with both.
- The OTel Collector sits between Flagsmith and your backends. It receives OTLP data, processes or filters it, and forwards it to one or more destinations: Grafana Tempo for traces, Loki for logs, or a commercial APM tool. Change backends, fan out to multiple destinations, add sampling rules—without touching your Flagsmith configuration.
Putting this together, a Grafana-based stack looks like this:
If you're already running Grafana and Prometheus for the rest of your infrastructure, integrating Flagsmith is a matter of pointing the collector at the right endpoint and enabling the variables above.
Flagsmith and OpenTelemetry FAQs
Does enabling OpenTelemetry affect Flagsmith's performance?
No. When OTEL_EXPORTER_OTLP_ENDPOINT isn't set, no OTel code loads at all. Zero runtime overhead.
Can I use Prometheus and OpenTelemetry at the same time?
Yes, and that's the recommended setup. Prometheus handles metrics via the /metrics endpoint. OTel handles traces and structured logs. They're complementary—not alternatives.
Do I need an OTel Collector, or can I send data directly to a backend?
Both work. Flagsmith sends to any OTLP/HTTP endpoint, so you can point it directly at a compatible backend like Grafana Tempo or SigNoz. A Collector adds flexibility—fan-out to multiple backends, sampling rules, filtering—but it's not required to get started.
Which backends does Flagsmith's OTel support work with?
Any backend that accepts OTLP: Grafana Tempo, Jaeger, SigNoz, Datadog, Honeycomb, and others. No vendor lock-in.
Is OpenTelemetry support available on all Flagsmith plans?
OTel support is available for self-hosted deployments. If you're on Flagsmith Cloud and want to discuss observability options, get in touch with our team.


.png)
.png)

.png)

.png)


.png)


.webp)