
How Prometheus, Flagsmith, and Some Good Old-Fashioned Compression Helped Us Solve Customer Pain


Part of our Tales from the Sprint series.
TL;DR
- Problem: Customers wanted to store more data on our edge network, but we’re nearing limits because of Dynamo DB constraints.
- Solution: The team explored rearchitecting, but realized that compression could be an effective solution.
- Rollout Strategy: Phased Rollout to 10% and gradually increasing based on success of observability metrics
- Technology Used: Prometheus metrics, Grafana dashboard, and Flagsmith for feature management.
- Initial rollout to 10% of traffic revealed a critical bug. We were able to identify, rollback and re-ship the improvement before any negative impact on our users.
The challenge
In order to provide customers with additional targeting and logic, our product allows you to store everything about your feature flags, segments, and identity overrides in an environment document. These documents exist as a JSON file that lives in DynamoDB. While our customers love this for speed, scale and reliability; it introduces a hard size limit of 400 KB. To ensure customers don’t go near that, we put arbitrary limits and warnings at lower storage levels.
For most customers, this limit is more than enough. They’ll never get anywhere near it. But as organisations grow—more flags, more segments, more complex JSON configuration values—those documents tend to grow too.
While this was something we monitored, the real impact to our team was happening in support.
As a customer reached the artificial limit, they would contact us to see if we can manually raise their limit. Upon request, we would do this for them and a few weeks later, they’d be back again—bad for customers and bad for our team. After enough of these tickets, we realized that we needed a real fix.
The solution: Adding a compression step
As we set out to solve this as a team, our first instinct was to rethink the data architecture. This solution would lead us to decoupling segments from the environment document and rewrite how data is stored. However, this is the kind of project that takes months and carries a significant risk of its own.
After thinking it over, Gagan Trivedi, one of our most tenured backend engineers, pointed out something that became obvious in retrospect: JSON compresses extremely well.
The data is full of repetitive keys, similar structures, and envelope content that gzip handles incredibly efficiently. Rather than restructure everything, why not just compress it?
We tested our solution on the real-world customer that had a 355 KB document. It was nearing our hard cap.
After we compressed it with gzip, it came out at 37 KB, a 90% reduction. The DynamoDB limit that had been a hard constraint became, effectively, a non-issue. The next challenge was rolling it out safely.
The solution’s key success metrics
The rollout strategy: phased rollout with observability metrics
The plan was to add compression and decompression to critical write and read paths of our architecture, which meant we couldn’t afford to break anything. We had to roll out the change gradually, and we needed additional observability to assess that the solution was, in fact, working for our customers.
Luckily, the team had recently spent time on our Grafana and Prometheus integration.
Although it has strong connections with Grafana, Prometheus is an open standard, which means it works everywhere.
For the compression rollout, we built two custom histograms so every single write was captured:
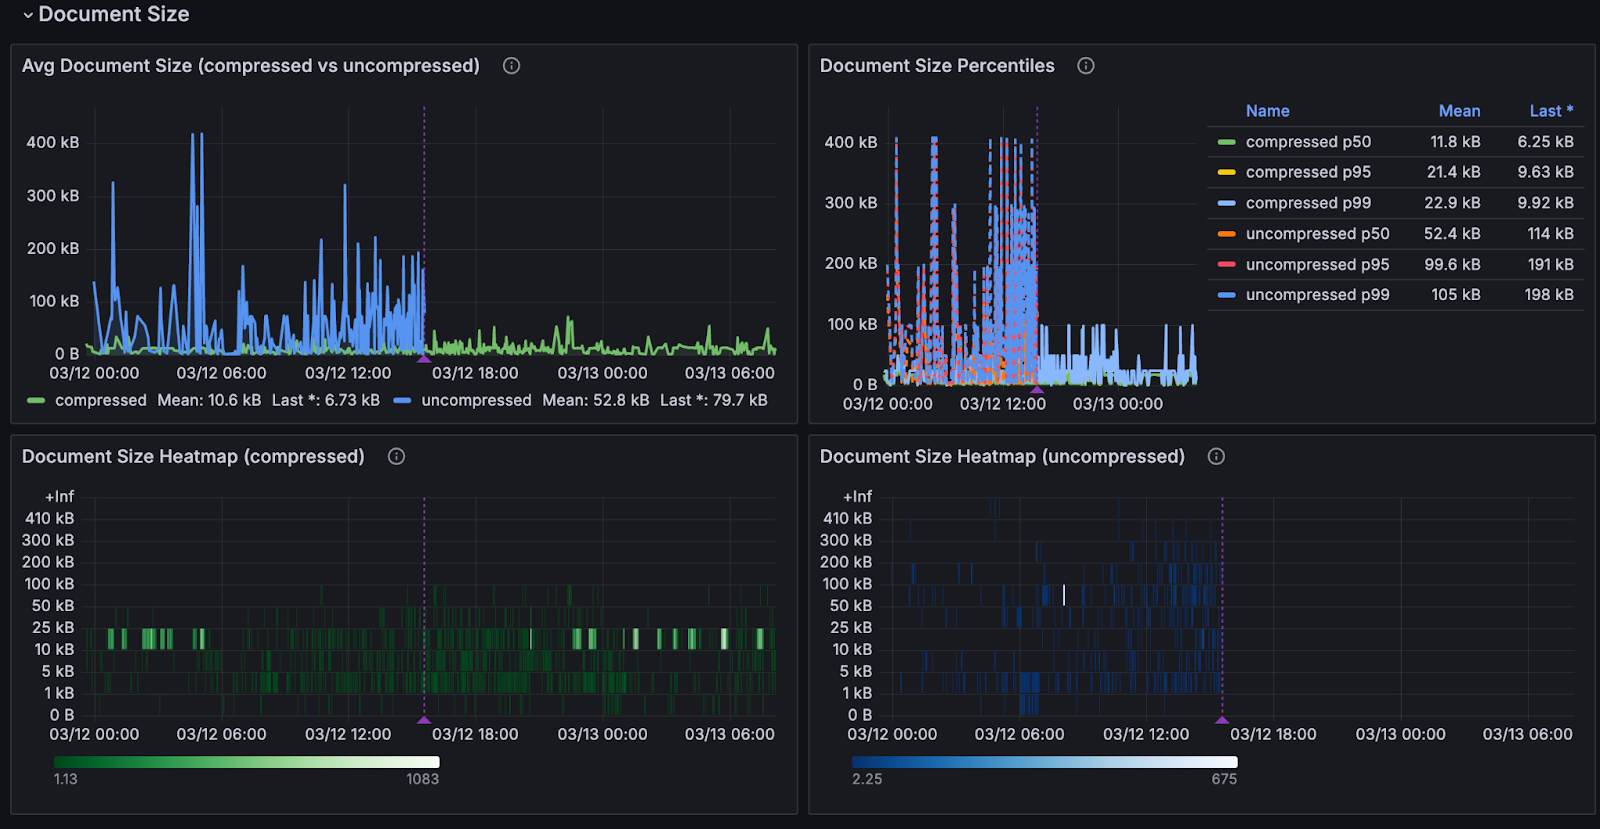
- One tracking document sizes at write time, labelled by whether the document was compressed or not, with buckets running up to the 400 KB DynamoDB limit
- One tracking the compression ratio itself
We also built a small estimation utility to calculate what the uncompressed byte count would have been, meaning we could compare the two paths directly, even when we were only compressing a fraction of documents.
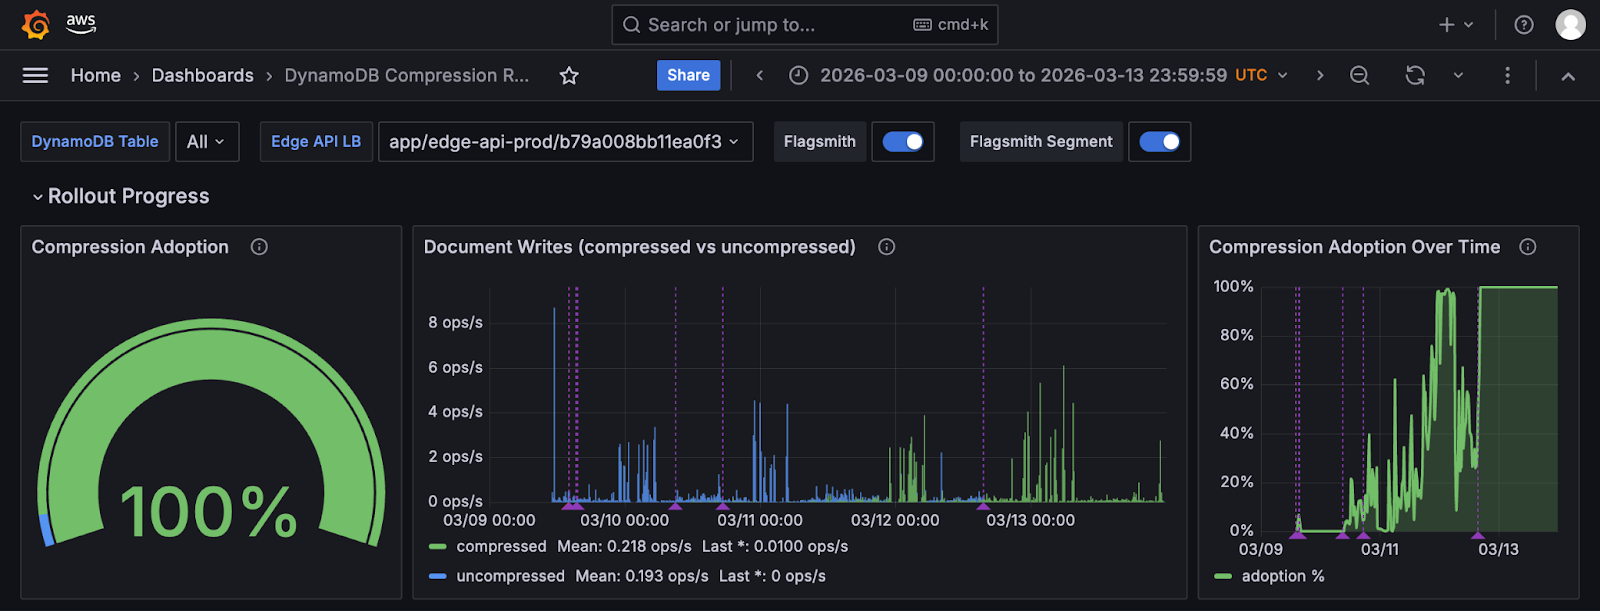
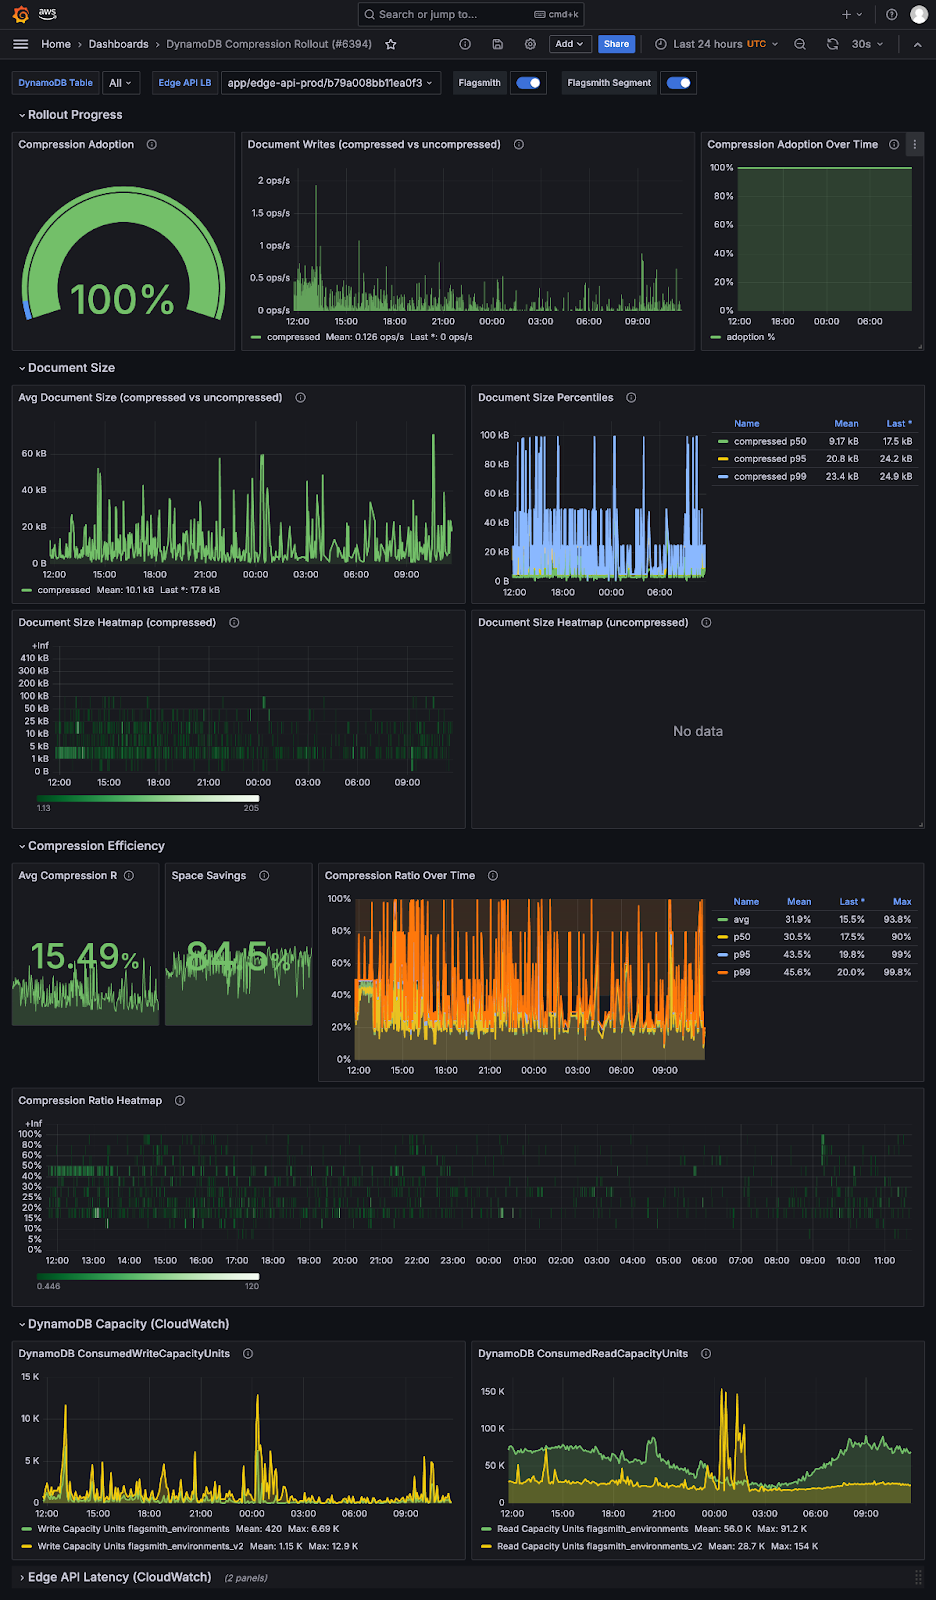
The result was a dedicated Grafana dashboard called “DynamoDB Compression Rollout” showing document size distribution as before-and-after heatmaps, compression ratios across the fleet, adoption rate, and, most usefully, Flagsmith annotations marking every time the rollout percentage changed.
You could look at the timeline and see exactly what happened when we bumped from 10% to 20%, or rolled back to zero.
Kim Gustyr, the Engineer who lead the rollout strategy, describes it as “coming up with metrics up front and thinking of your impact up front.”
Building the rollout: Flagsmith using Flagsmith
The compression feature was gated behind a Flagsmith feature flag called compress_dynamo_documents, evaluated per organisation using our own SDK in local evaluation mode. By leveraging local evaluation, it meant that we could target specific customers or a percentage of all customers and change that percentage without any redeployment.
The code path was simple:
- Check the flag for that organisation on every environment document write.
- If enabled, compress and write the compressed document; if not, write as normal. Reads always handle both formats regardless.
- The kill switch was instant—flip the flag off, all subsequent writes revert to uncompressed immediately.
Before we touched the rollout percentage at all, we needed to know it was working. Which meant we needed to be able to see it working.
The rollout, including what went wrong
On March 9th, we enabled compression for 10% of SaaS organisations. Within hours, Sentry flagged errors.
A customer had a data inconsistency that existed quietly in their environment and had never caused a problem until compression brought it into contact with strict Pydantic validation.
Immediately, the rollout went back to 0%. No additional deployments. The fix was in production the same day.
On March 10th, we went back to 10% and encountered a different issue this time: the segments endpoint reading compressed binary fields without decompressing them. We rolled back to 0%, fixed it the same day, and based on zero errors, bumped it up to 20%.
By March 12th, we were at 100%!
Learnings
The best part of this all was that the compression bugs during rollout never affected a single customer. Both were flagged and caught within minutes of enabling compression for 10% of organisations.
Without the phased rollout using feature flags, both would have hit 100% of customers simultaneously.
The results of the rollout
The impact beyond fixing the original problem has been substantial.
- DynamoDB read latency dropped from around 4.7 ms before the rollout to 1.6 ms in steady state—a 66% reduction and a direct byproduct of smaller documents being faster to retrieve.
- Weekly read capacity unit consumption fell from roughly 58 million per day to 17 million per day, a 71% reduction that translates directly to lower infrastructure costs.
- The 355 KB document that was close to the DynamoDB limit is now 37 KB.
Crucially, the limits we had imposed on customers—100 features and 100 segments per project in SaaS—will be raised significantly or removed from the UI entirely, because they no longer mean anything for the vast majority of users.
Conclusion
The solution was simple. The confidence to ship it safely was the hard part. Feature flags gave us that confidence.
Flagsmith is a market-leading feature flag software. If you want to use Flagsmith to run your own observability-driven rollouts, in the back end or anywhere else, you can get started for free.
And for those interested, here’s what the entire dashboard looks like:


OpenTelemetry, without the vendor lock-in: Introducing full observability for Open Source and Self-Hosted Flagsmith customers


.png)
.png)

.png)

.png)


.png)


.webp)