What Is A/A Testing and When Should You Run an A/A Test?


Every experimentation program runs on an instrument, the good ones of which get calibrated.
That's the advantage A/A testing gives you. You run two identical variations, split 50/50, but you're not hoping for a variation in your result. Instead, you're earning the right to trust the next one—the p-value, the green banner, and the lift you'll actually act on.
A/A testing is the calibration step that gives you the confidence to continue testing. Silence is golden: no difference between segments, no false winner, no phantom lift, and nothing to explain away later. Just proof that the instrument reads zero when there's nothing to measure—so when it does read something, you believe it.
What is A/A testing?
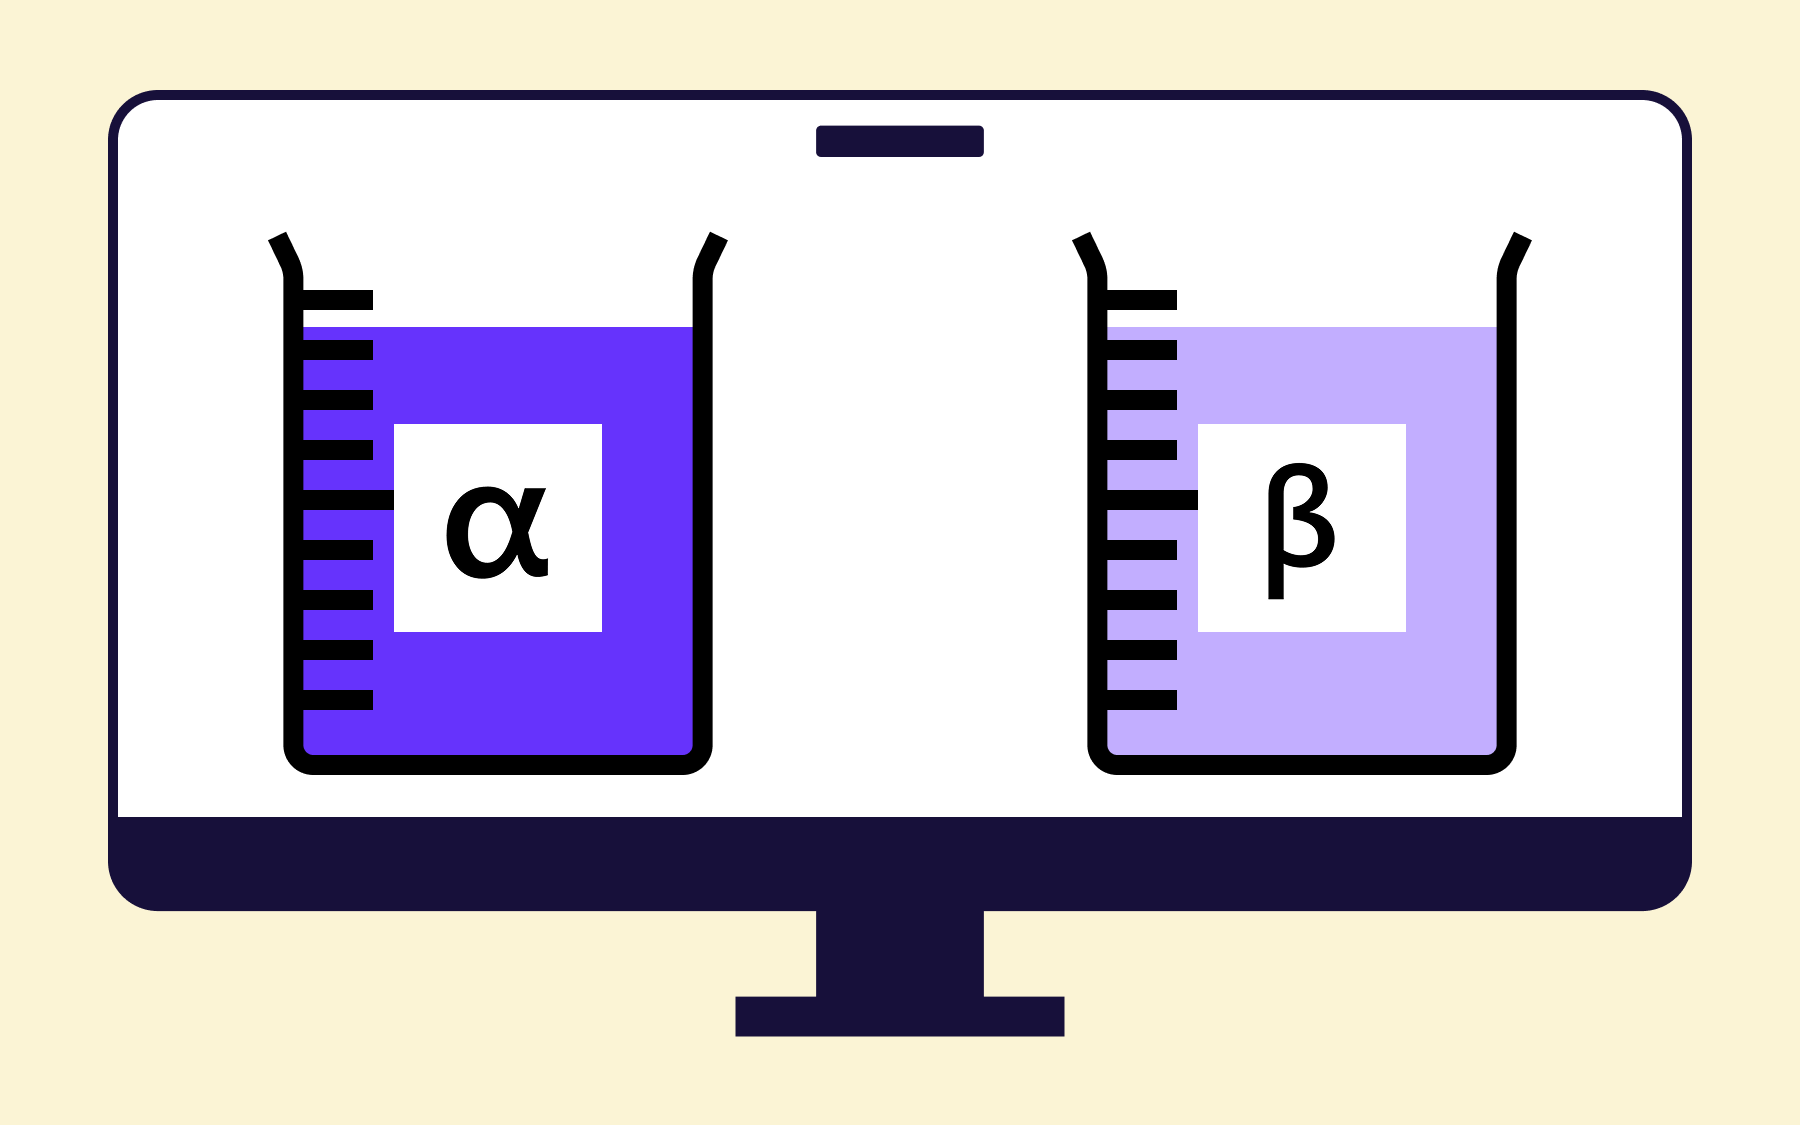
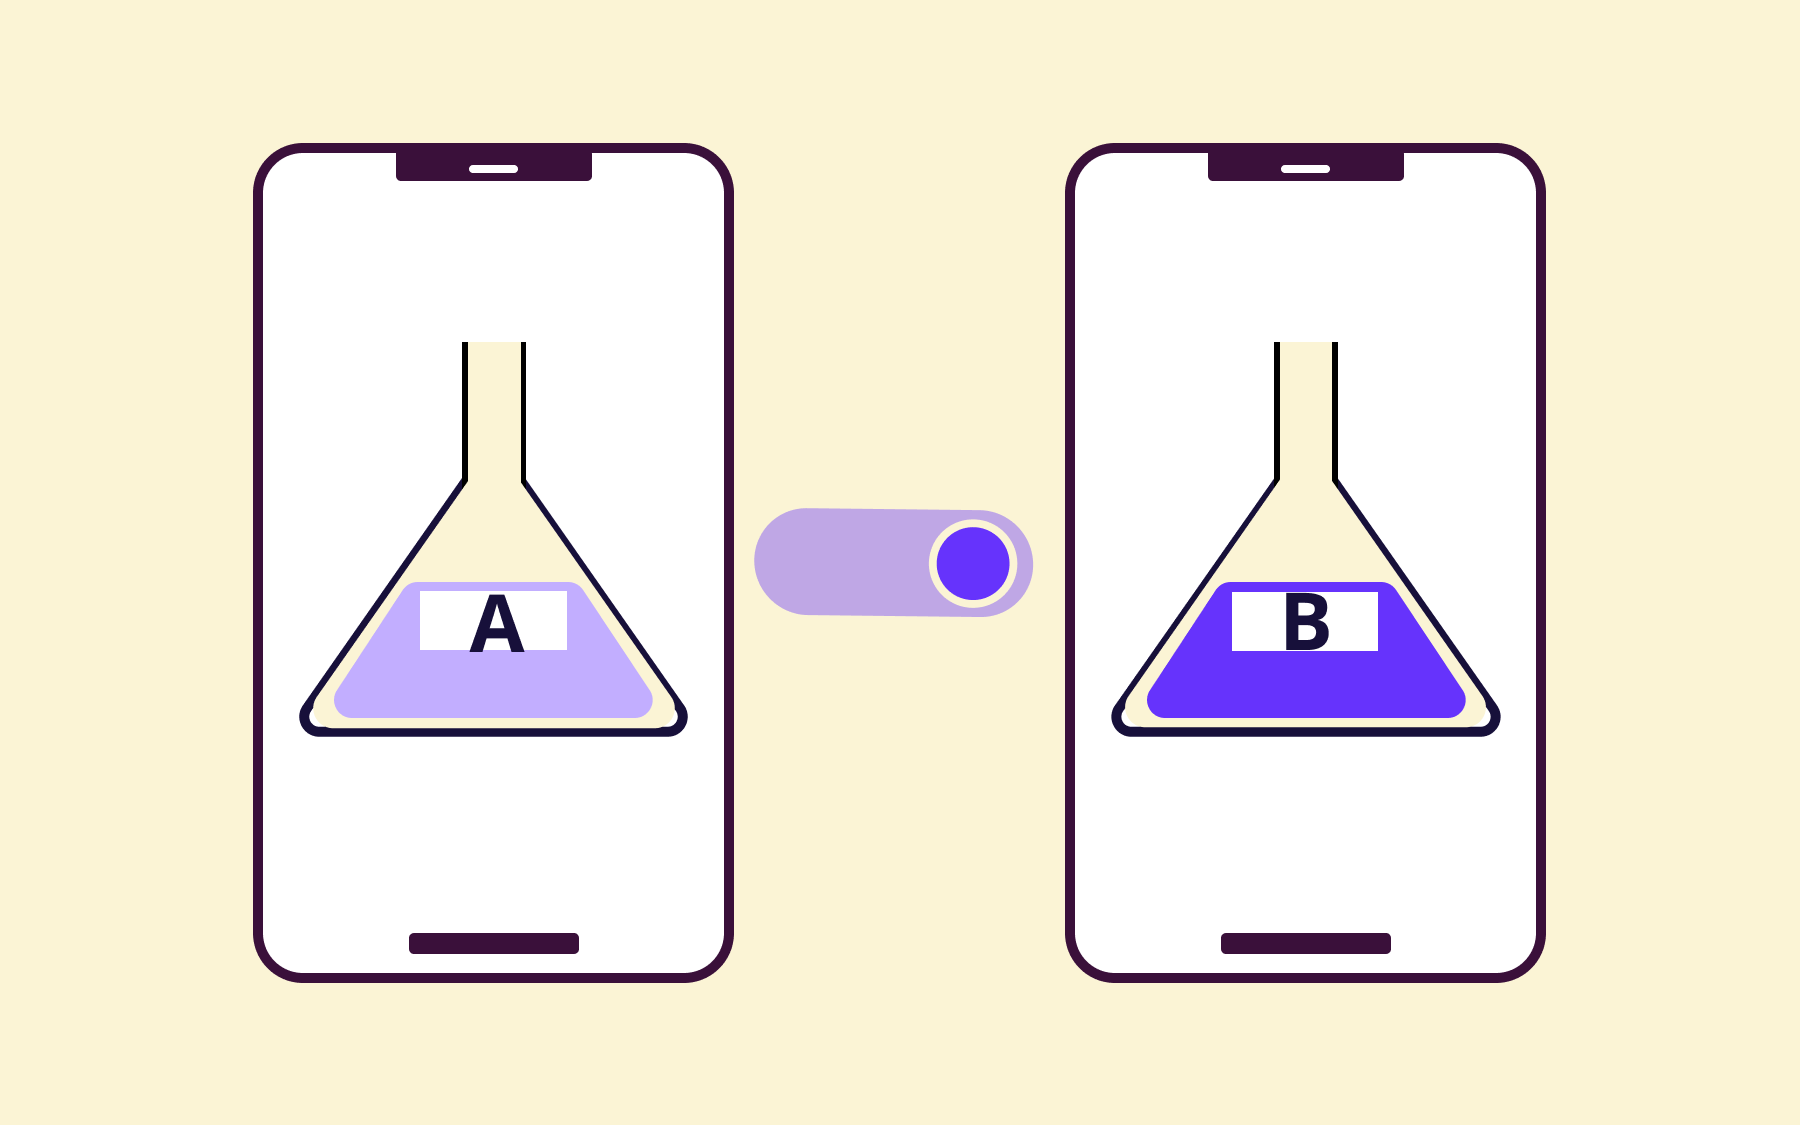
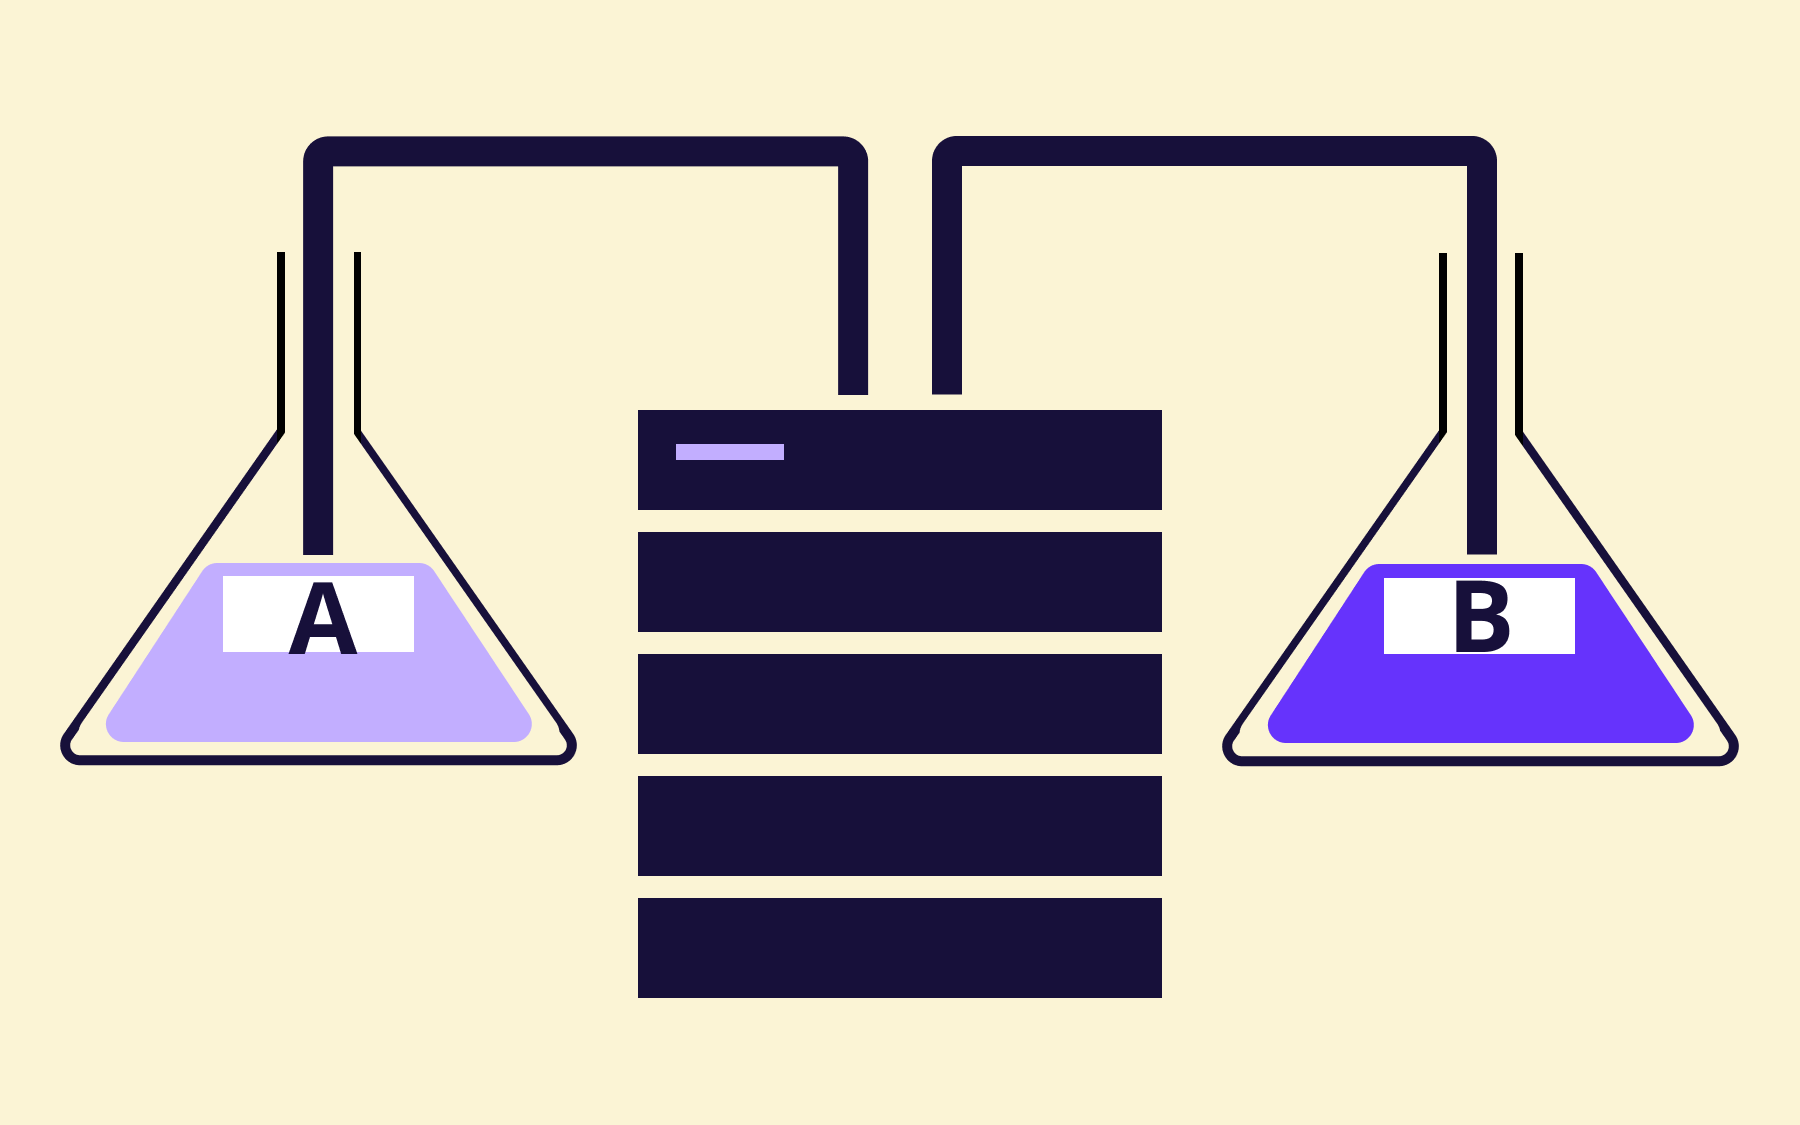
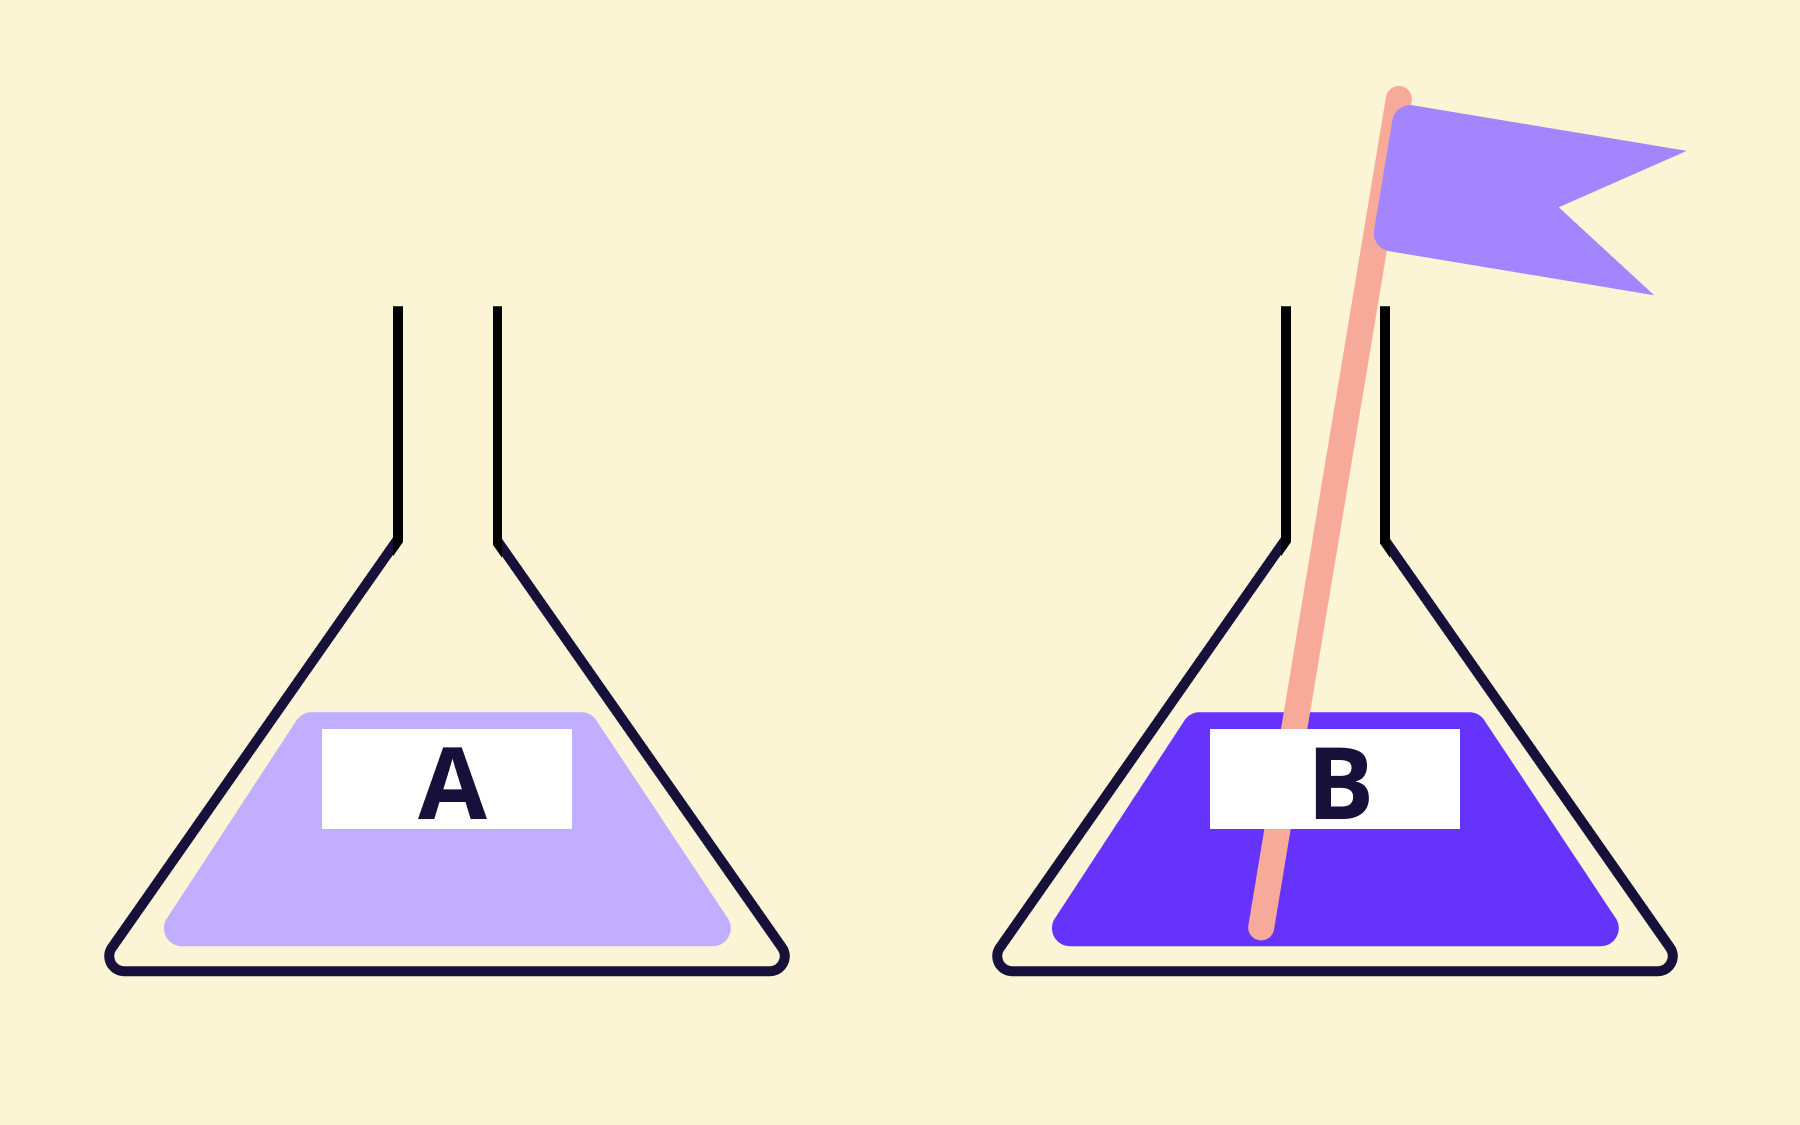
An A/A test splits your traffic into two groups and shows both of them the exact same experience—the same page, the same UI, the same feature, the same code path. Nothing changes. The only variable is which bucket a visitor lands in.
Essentially, it's an A/B test where the "B" is a duplicate of the "A." You're not testing a hypothesis about a change. You're testing whether your testing tool can tell the difference between two identical versions when there isn't one.
In a feature-flagged setup, this usually takes the form of a single flag with a 50/50 rollout, both variants pointing at the same code. Exposure logging fires for both groups and the stats engine runs the same statistical significance calculation it would run on a real experiment. If everything works, it reports nothing, because there's nothing there to report.
That inversion—hoping for nothing rather than something—is what separates the two test types.
The two aren't rivals. One checks the instrument, the other uses it.
Why run an A/A test before an A/B experiment?
You calibrate a scale before you trust the weight it gives you. A/A testing does the same job for an experimentation platform.
Run one before you lean on a new testing tool, a new SDK version, or a migrated experimentation platform for a decision that has real consequences. If you trust the instrument, then you trust what it tells you.
A well-run A/A test also hands you two things you'll need later:
- A baseline conversion rate to compare future results against
- An early warning on configuration errors
These configuration errors could show up as targeting rules that leak traffic to the wrong segment, an SDK that's not logging exposures consistently, or a randomisation routine that skews 55/45 instead of 50/50.
Catch the warning before it quietly corrupts every A/B test you run on the same setup, not after you've already shipped a decision based on it.
How A/A testing validates your experimentation tools
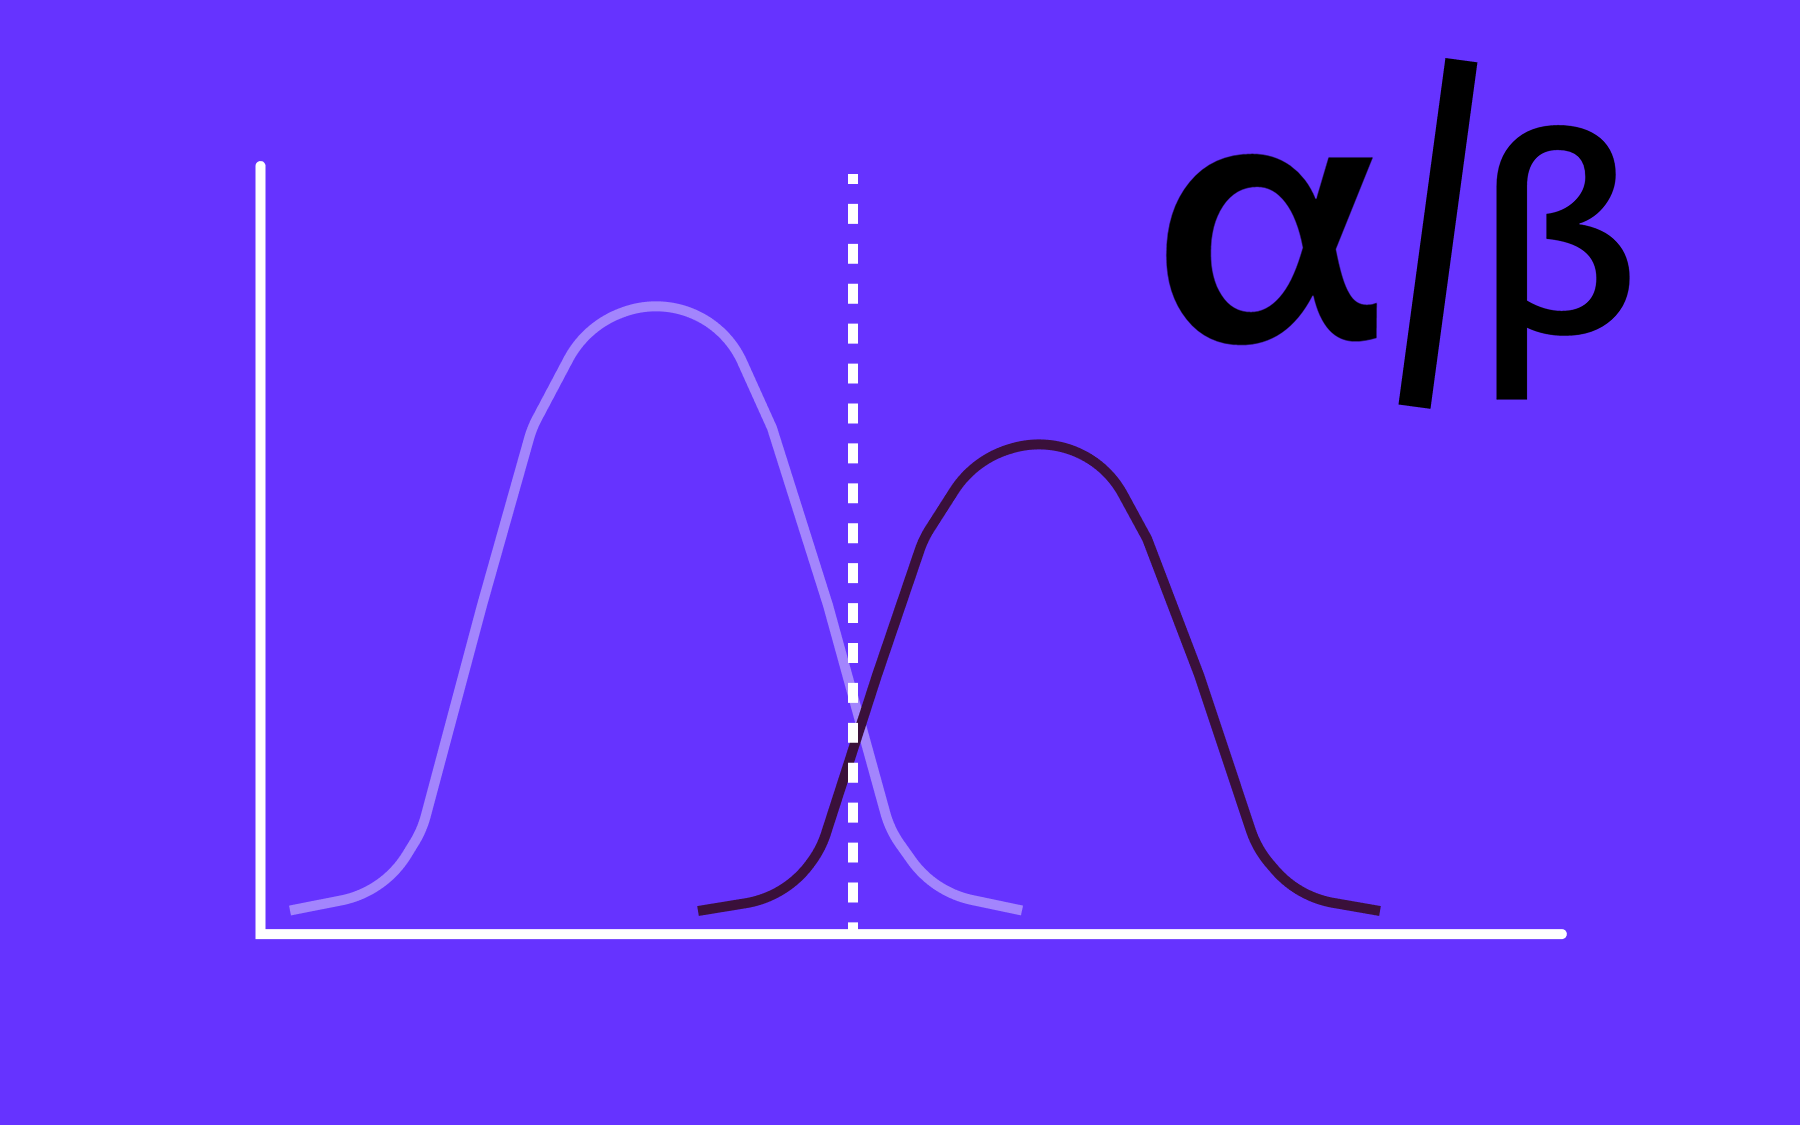
Here's the mechanism, stripped down: because both variants are identical, the null hypothesis is true by construction. There's no real difference to find. So the test should report exactly that: a statistically inconclusive result, most of the time.
When it doesn't, you've learned something. A "winning variation" between two identical pages isn't a real difference; it's a signal that something in the pipeline is broken—most often a configuration error in how the flag is evaluated, or a mismatch between what your testing tool counts as a conversion and what your web analytics tool counts.
Sometimes it's even simpler: a sample ratio mismatch, where the traffic split has drifted away from 50/50.
If your tool reports 50.4% versus 49.6%, fine—that's random noise. If it reports 58% versus 42%, the randomisation itself is broken, and no amount of statistical significance on the metrics will save you from a biased experiment.
Cross-check your testing tool's numbers against a separate web analytics tool, like Google Analytics, on the same traffic. Don't expect an exact match, since the two tools count things slightly differently. You're checking that the two sets of numbers are roughly the same. A large, unexplained gap between them is usually a data collection problem, not a coincidence.
This instinct is the same as the one behind checking a build pipeline before you trust its output. It's not about inspecting the pipeline because you expect it to fail; it's about inspecting it because the cost of trusting a broken one, without realising, for months, is far higher than the cost of one boring test that tells you nothing happened.
When should you run an A/A test?
Not before every experiment. There are usually conflicting opinions on whether it's worth running one, even among experienced data science teams—some treat it as essential hygiene, others as a distraction from real testing time.
Run one when:
- You're adopting a new testing tool or feature flagging platform, or when you've made a major change to how experiments are set up or instrumented.
- Your experimentation tool and your analytics tool have started disagreeing about basic numbers like site visitors or conversion rates.
- Before a business-critical rollout, where a false positive would mean shipping the wrong decision to your entire user base.
Unless your situation fits into one of the above, you can skip A/A testing.
A/A testing needs a much larger minimum sample size than a typical A/B test—there's no real effect to detect, so you need considerably more test data before you can be confident the near-identical numbers you're seeing are genuine and not just an underpowered test.
Running one before every single experiment eats into the testing time you could be spending on experiments that actually tell you something. A semi-regular cadence, tied to specific trust-building moments rather than a fixed schedule, gets you most of the value without the downsides.
How to run an A/A test
Setting up an A/A test is simple.
- Pick your surface: A homepage, a signup flow, a checkout cart, an onboarding step. Somewhere stable, with enough site visitors moving through it that you'll reach statistical significance without waiting a season for the sample size to fill in. Avoid a page where an unrelated external factor, like a paid traffic campaign, could distort what you're measuring.
- Configure the split: Set up two identical variations behind a single flag or gate, at a 50/50 split, then confirm exposure logging fires correctly on both sides before the test starts.
- Check the targeting rules that decide who goes into which bucket. A rule that's scoped incorrectly is a common source of a false A/A "winner."
- Set your sample size and duration up front, based on the smallest difference you'd actually care about catching if the pipeline were broken. Then, let it run without touching the setup.
Changing anything mid-test—a targeting rule, a code path, or an SDK version, for example—invalidates the whole exercise. You've reintroduced a real variable into what was supposed to be a controlled comparison of two identical variations.
Interpreting A/A test results
A good A/A test result is boring by design. Testing identical variations should mean both track closely on whatever key performance indicators you're watching, the traffic split should sit close to 50/50, and the difference between them should land below your significance threshold.
Statistical significance is a probability, not a certainty. At a 95% confidence level, roughly 1 in 20 A/A tests will report a statistically significant difference between two identical variations purely by random chance. That's not a bug. It's what a 5% significance level means, applied to a case where you already know the true difference is zero. One surprising result doesn't mean your testing software is broken, but a pattern across several does.
Data peeking makes things worse. Check your results continuously, and you're far more likely to catch one of those random blips right as it crosses your significance threshold, then stop the test and declare a problem that isn't there.
Decide your sample size and duration before you start, look once you've hit it, and resist the urge to refresh the dashboard every hour. The p-values you're chasing were never designed to survive that kind of scrutiny.
You'll see different numbers depending on which statistical engine you have underneath your testing tool.
- A frequentist engine reports p-values against a fixed significance threshold.
- A tool built on Bayesian statistics instead reports something like a probability that one variant beats the other, or a credible interval for the difference between them.
The interpretation changes slightly, but the goal doesn't: in an A/A test, that credible interval should sit comfortably around zero, and neither variant should look like a confident winner.
The limitations of A/A testing
A/A testing is not free, and it's not infallible, so you need to be prepared if you want to gain valuable insights.
Testing identical pages with two variations of your audience demands more traffic and more time than the A/B tests they're meant to validate, because there's no real effect inflating the numbers you're watching—just the underlying variance in your data.
It results in real testing time and real website traffic diverted from experiments that could produce an actual decision. Constant A/A testing could be a poor use of an optimisation program's limited runway, so make sure it's a validation step, not a habit.
A clean result does not buy you permanent trust. An inconclusive A/A test tells you the pipeline worked correctly at that moment, on that surface, with that configuration. It doesn't certify the tool forever. Treat it as a checkpoint you return to at specific moments.
Building experimentation you can actually trust
None of this works without a flagging layer that gives you clean control over who sees what, and reporting that tells you the truth about it. Feature flags help you build an A/A test in your development process—one flag, one 50/50 split, identical code on both sides, and exposure data you can actually audit.
Flagsmith gives that control to engineering and product teams, whether you're running a calibration check on a new setup or the real experiment that follows it. If you're evaluating a new testing tool or migrating your experimentation stack, sign up and see what it looks like to truly trust your own pipeline.
A/A testing FAQs
What's the difference between an A/A test and an A/B/A test?
An A/A test compares two identical variations against each other, on their own, with nothing else running. An A/B/A test adds a duplicate baseline alongside a real test variation—and it's usually a bad idea.
Combining a calibration check with a live experiment cannibalises the results of the real test and exposes you to confirmation bias, since you're now judging a single comparison instead of a clean distribution of outcomes.
How long should you run an A/A test?
Long enough to reach the sample size you calculated in advance, which is usually longer than a comparable A/B test would need. As a rough guide, plan for at least a full traffic cycle—a week, at minimum—so you're not drawing conclusions from a skewed slice of weekday or weekend visitors.
What sample size do you need for an A/A test?
More than you'd use for an equivalent A/B test, because you're trying to detect the absence of an effect rather than confirm the presence of one. The exact minimum sample size depends on your current baseline conversion rate and the smallest deviation from it you'd want to catch—smaller deviations and lower-traffic pages both push the required sample size up.




































OpenTelemetry, without the vendor lock-in: Introducing full observability for Open Source and Self-Hosted Flagsmith customers